

601
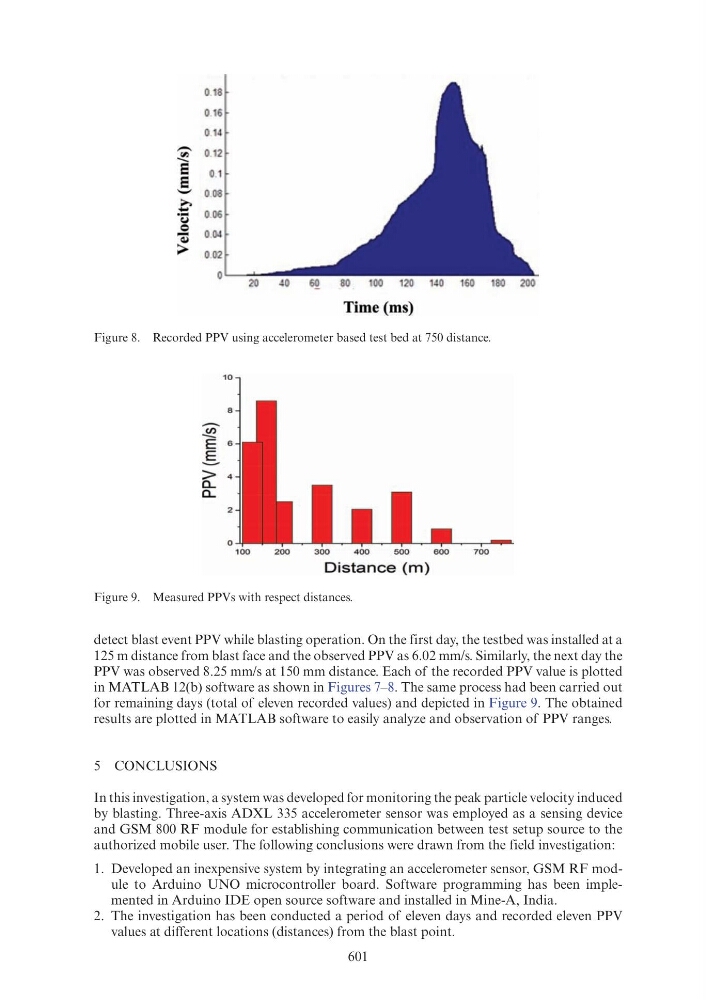
detect blast event PPV while blasting operation. On the first day, the testbed was installed at a
125 m distance from blast face and the observed PPV as 6.02 mm/s. Similarly, the next day the
PPV was observed 8.25 mm/s at 150 mm distance. Each of the recorded PPV value is plotted
in MATLAB 12(b) software as shown in Figures 7–8. The same process had been carried out
for remaining days (total of eleven recorded values) and depicted in Figure 9. The obtained
results are plotted in MATLAB software to easily analyze and observation of PPV ranges.
5 CONCLUSIONS
In this investigation, a system was developed for monitoring the peak particle velocity induced
by blasting. Three-axis ADXL 335 accelerometer sensor was employed as a sensing device
and GSM 800 RF module for establishing communication between test setup source to the
authorized mobile user. The following conclusions were drawn from the field investigation:
1. Developed an inexpensive system by integrating an accelerometer sensor, GSM RF module to Arduino UNO microcontroller board. Software programming has been implemented in Arduino IDE open source software and installed in Mine-A, India.
2. The investigation has been conducted a period of eleven days and recorded eleven PPV
values at different locations (distances) from the blast point.
Figure 8. Recorded PPV using accelerometer based test bed at 750 distance.
Figure 9. Measured PPVs with respect distances.
- "'
-- s
s
'-'
.......
...
·~
Q
- ~
;;;..
0.18
0.16
0.14
0.12
0. 1
B.l!a
0.06
0 .1)4
U2
0
10
8
............
~
E e
E.
>4
a...
a...
2
0
2G
100
40
6!
Time (ms)
2 00
300
4 00
500
600
700
Distance (m)