

560
repairs. As an example, Table 1 show conservative estimates of the costs of an engine failure
event. The parts and labor cost is based on the difference between the exchange value with
the manufacturer of a blown engine and the exchange value of a used engine i.e. an engine
that has reached its maximal engine hours without suffering a major failure. The engine life
loss is the dollar equivalent of the average proportion of engine life lost from the engine
not reaching its maximal engine hours. Truck and Fleet production are the equivalent revenu
lost by the affected truck and revenu lost around the affected truck by the fleet. These numbers were all based on actual cost taken from underground mines and conservative estimates.
Looking at the numbers, it is easily understood why preventing engine failure can be very
beneficial to a mine operation.
In order to train the model, historical data from truck engine failure was collected and
many different combinations of algorithms and transformations were tested. In this case,
SVMs prooved to be the most accurate at classifying data into “normal condition” or “imminent failure” categories. Different prediction horizons were also tested i.e. the time length of
the imminent failure warning, and the best results were achieved with a two weeks warning.
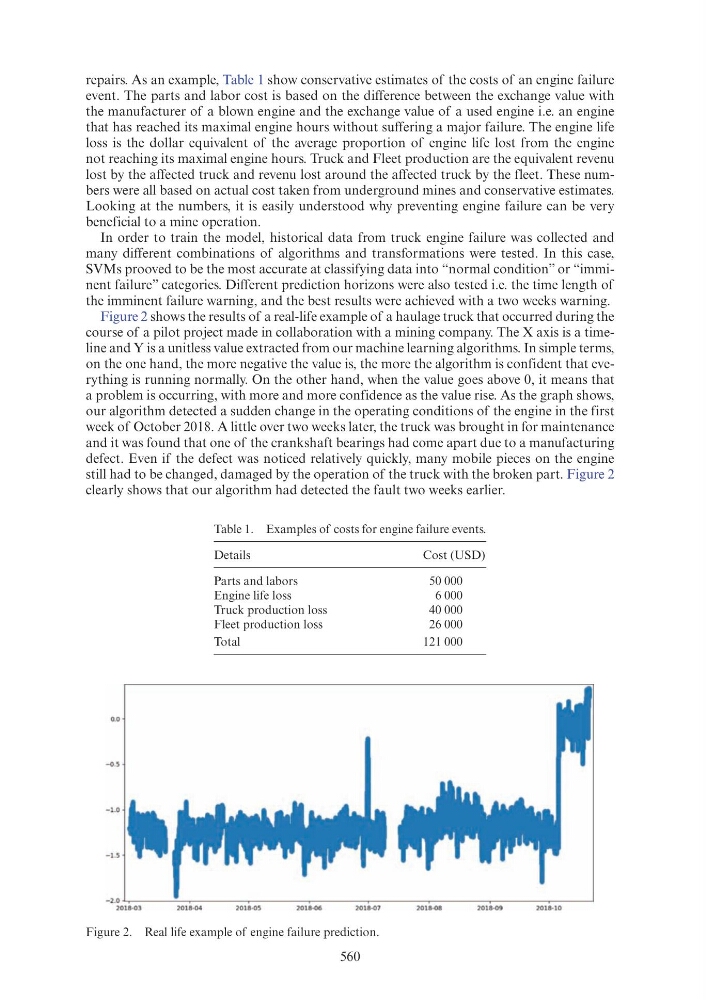
Figure 2 shows the results of a real-life example of a haulage truck that occurred during the
course of a pilot project made in collaboration with a mining company. The X axis is a timeline and Y is a unitless value extracted from our machine learning algorithms. In simple terms,
on the one hand, the more negative the value is, the more the algorithm is confident that everything is running normally. On the other hand, when the value goes above 0, it means that
a problem is occurring, with more and more confidence as the value rise. As the graph shows,
our algorithm detected a sudden change in the operating conditions of the engine in the first
week of October 2018. A little over two weeks later, the truck was brought in for maintenance
and it was found that one of the crankshaft bearings had come apart due to a manufacturing
defect. Even if the defect was noticed relatively quickly, many mobile pieces on the engine
still had to be changed, damaged by the operation of the truck with the broken part. Figure 2
clearly shows that our algorithm had detected the fault two weeks earlier.
Table 1. Examples of costs for engine failure events.
Details
Cost (USD)
Parts and labors
50 000
Engine life loss
6 000
Truck production loss
40 000
Fleet production loss
26 000
Total
121 000
Figure 2. Real life example of engine failure prediction.