

537
3 NUMERIC EXAMPLE
3.1 Input dataset
The proposed model was implemented for multiple cable shovels operating in an opencast
mine. The datasets were retrieved from a study by Roy et al. (2001), and include reliability
and maintenance probability distribution functions for the subsystems of three shovels in
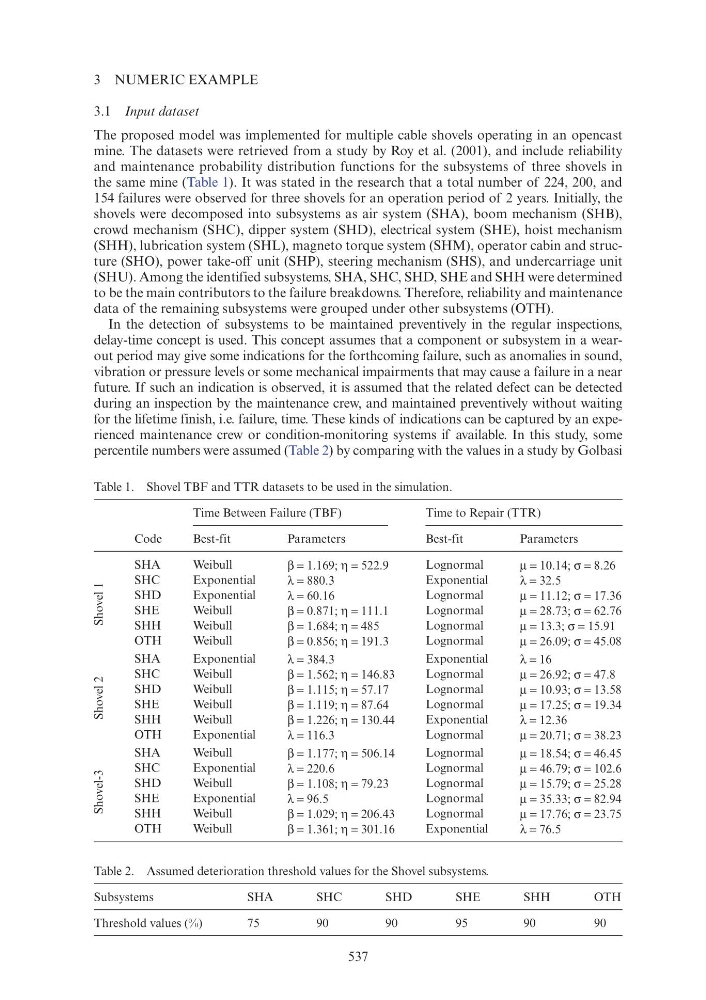
the same mine (Table 1). It was stated in the research that a total number of 224, 200, and
154 failures were observed for three shovels for an operation period of 2 years. Initially, the
shovels were decomposed into subsystems as air system (SHA), boom mechanism (SHB),
crowd mechanism (SHC), dipper system (SHD), electrical system (SHE), hoist mechanism
(SHH), lubrication system (SHL), magneto torque system (SHM), operator cabin and structure (SHO), power take-off unit (SHP), steering mechanism (SHS), and undercarriage unit
(SHU). Among the identified subsystems, SHA, SHC, SHD, SHE and SHH were determined
to be the main contributors to the failure breakdowns. Therefore, reliability and maintenance
data of the remaining subsystems were grouped under other subsystems (OTH).
In the detection of subsystems to be maintained preventively in the regular inspections,
delay-time concept is used. This concept assumes that a component or subsystem in a wearout period may give some indications for the forthcoming failure, such as anomalies in sound,
vibration or pressure levels or some mechanical impairments that may cause a failure in a near
future. If such an indication is observed, it is assumed that the related defect can be detected
during an inspection by the maintenance crew, and maintained preventively without waiting
for the lifetime finish, i.e. failure, time. These kinds of indications can be captured by an experienced maintenance crew or condition-monitoring systems if available. In this study, some
percentile numbers were assumed (Table 2) by comparing with the values in a study by Golbasi
Table 1. Shovel TBF and TTR datasets to be used in the simulation.
Code
Time Between Failure (TBF)
Time to Repair (TTR)
Best-fit
Parameters
Best-fit
Parameters
Shovel 1
SHA
Weibull
β = 1.169; η = 522.9
Lognormal
μ = 10.14; σ = 8.26
SHC
Exponential
λ = 880.3
Exponential
λ = 32.5
SHD
Exponential
λ = 60.16
Lognormal
μ = 11.12; σ = 17.36
SHE
Weibull
β = 0.871; η = 111.1
Lognormal
μ = 28.73; σ = 62.76
SHH
Weibull
β = 1.684; η = 485
Lognormal
μ = 13.3; σ = 15.91
OTH
Weibull
β = 0.856; η = 191.3
Lognormal
μ = 26.09; σ = 45.08
Shovel 2
SHA
Exponential
λ = 384.3
Exponential
λ = 16
SHC
Weibull
β = 1.562; η = 146.83
Lognormal
μ = 26.92; σ = 47.8
SHD
Weibull
β = 1.115; η = 57.17
Lognormal
μ = 10.93; σ = 13.58
SHE
Weibull
β = 1.119; η = 87.64
Lognormal
μ = 17.25; σ = 19.34
SHH
Weibull
β = 1.226; η = 130.44
Exponential
λ = 12.36
OTH
Exponential
λ = 116.3
Lognormal
μ = 20.71; σ = 38.23
Shovel-3
SHA
Weibull
β = 1.177; η = 506.14
Lognormal
μ = 18.54; σ = 46.45
SHC
Exponential
λ = 220.6
Lognormal
μ = 46.79; σ = 102.6
SHD
Weibull
β = 1.108; η = 79.23
Lognormal
μ = 15.79; σ = 25.28
SHE
Exponential
λ = 96.5
Lognormal
μ = 35.33; σ = 82.94
SHH
Weibull
β = 1.029; η = 206.43
Lognormal
μ = 17.76; σ = 23.75
OTH
Weibull
β = 1.361; η = 301.16
Exponential
λ = 76.5
Table 2. Assumed deterioration threshold values for the Shovel subsystems.
Subsystems
SHA
SHC
SHD
SHE
SHH
OTH
Threshold values (%)
75
90
90
95
90
90