

512
the speed of the machine is higher (samples are average values for 15-minute blocks). The
calculation done for context: BRAKP = 0, SPEED> 1, GEAR 2 ÷ 3.
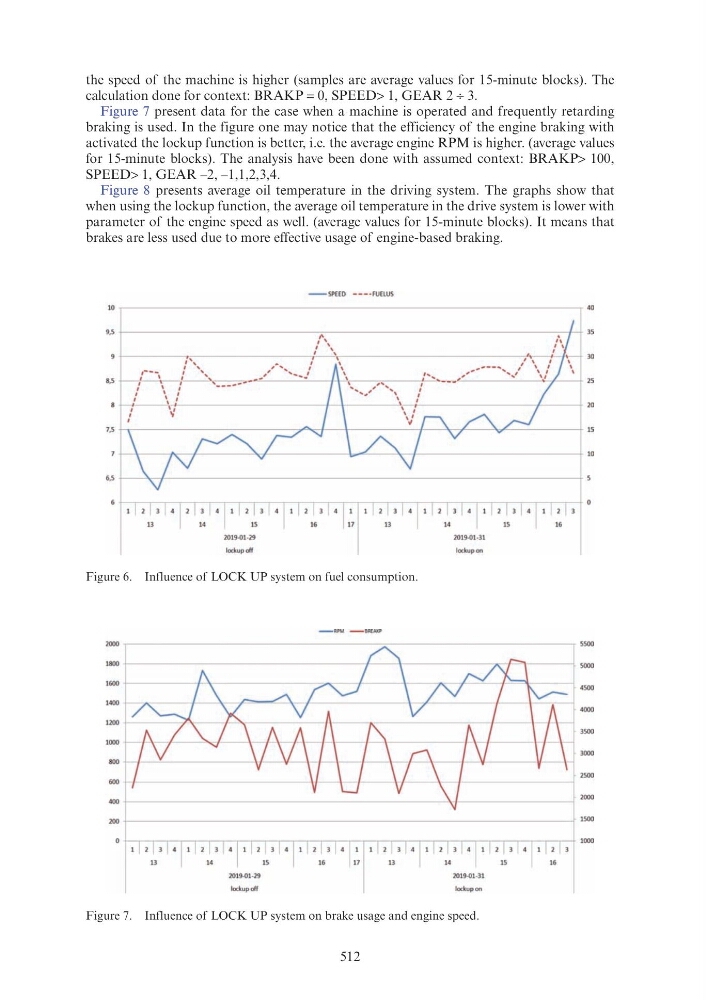
Figure 7 present data for the case when a machine is operated and frequently retarding
braking is used. In the figure one may notice that the efficiency of the engine braking with
activated the lockup function is better, i.e. the average engine RPM is higher. (average values
for 15-minute blocks). The analysis have been done with assumed context: BRAKP> 100,
SPEED> 1, GEAR –2, –1,1,2,3,4.
Figure 8 presents average oil temperature in the driving system. The graphs show that
when using the lockup function, the average oil temperature in the drive system is lower with
parameter of the engine speed as well. (average values for 15-minute blocks). It means that
brakes are less used due to more effective usage of engine-based braking.
Figure 6. Influence of LOCK UP system on fuel consumption.
Figure 7. Influence of LOCK UP system on brake usage and engine speed.
- -SPEED ---· FUELUS
10 ~--------------------------------------------------------------------------------~ 40
9.5 +-----------------------------------~ ~ - ,------------------------------------------~f-+ 35
, '
8,5
+-----------~---------------------f: ___ '~--------------------------------~r-~~~-+ 30
: ',,
,.....
,
...... --...... ,'' \
: ' .........
... ...... ,'' .............. /
, ......... ___ ,,,...
' ... '
:
____ ...
,
,
lockup off
2019-01-29
lockup off
lockup on
2019-01-31
lockup on
25