

494
longwall as well as the formation of cavities. A large cavity has the potential to halt production for
periods in excess of 36 hours and can create harmful situations for operators. In addition, poor
performing roof supports will slow the overall mining operation by reducing the production rate.
By using analytical techniques, the Smart Solutions team can provide the mining crew
the proper guidance to manage, and more importantly, resolve, dangerous situations such
as the presence of failing roof cavities. Long-term data can help operations realize inherent
production improvements, ultimately resulting in a safer work environment—a key outcome
for every mining operator. Through cloud systems and edge-analytics, Komatsu is able to
improve the response time for notifications and alerts that are sent to mine personnel via
machine control or portable electronic devices.
4.3 Shear cycle optimization
Longwall systems can consist of approximately 210 roof supports with a face length in excess
of 430 m. Coal seam thickness can vary from 1.7 m to 7 m. The optimization of the roof supports’ lower, advance, set and shearer cycle speed provides data that allows process optimization through the Faceboss RS20s and ASA automation systems.
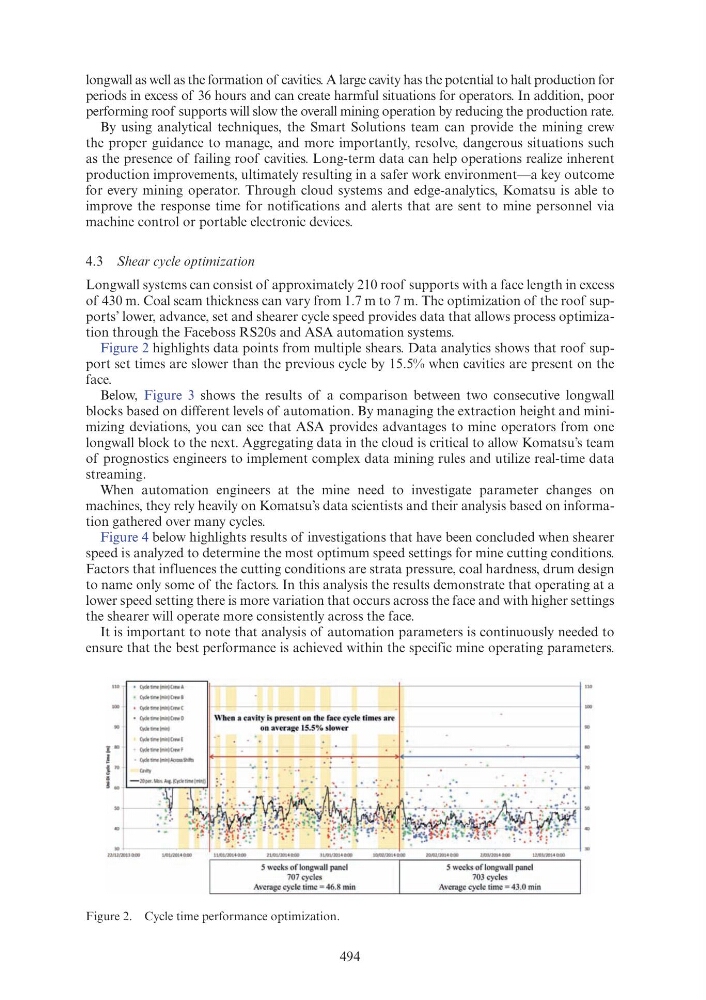
Figure 2 highlights data points from multiple shears. Data analytics shows that roof support set times are slower than the previous cycle by 15.5% when cavities are present on the
face.
Below, Figure 3 shows the results of a comparison between two consecutive longwall
blocks based on different levels of automation. By managing the extraction height and minimizing deviations, you can see that ASA provides advantages to mine operators from one
longwall block to the next. Aggregating data in the cloud is critical to allow Komatsu’s team
of prognostics engineers to implement complex data mining rules and utilize real-time data
streaming.
When automation engineers at the mine need to investigate parameter changes on
machines, they rely heavily on Komatsu’s data scientists and their analysis based on information gathered over many cycles.
Figure 4 below highlights results of investigations that have been concluded when shearer
speed is analyzed to determine the most optimum speed settings for mine cutting conditions.
Factors that influences the cutting conditions are strata pressure, coal hardness, drum design
to name only some of the factors. In this analysis the results demonstrate that operating at a
lower speed setting there is more variation that occurs across the face and with higher settings
the shearer will operate more consistently across the face.
It is important to note that analysis of automation parameters is continuously needed to
ensure that the best performance is achieved within the specific mine operating parameters.
Figure 2. Cycle time performance optimization.
• Cyde tim~ (m.n)CrewA
• (ydt t•mt(m•n)(rtw8
• Cyde time(mln)CrtwC
• C)'de timt(min)CrtwD
Cyde t1me(m1n)
C)'\k time(mln)Cr""'E
]: ao
+ Cvdetimr(mio)CrewF
~
! 70
~
• l'ydl> tlllll'(mln) AI:r=~lla
(a.,;ty
! "' jL-'---...,.;,.:--,c....,;;,I\
22/12/20130,00
tft)1}2014 0:00
\ \1hen a cavity is presenl on lhe fac.e cycle times are
on average 15.5% slower
1 - - - - - - - - - - - - - - - - -1
2tft)l/20141t00
5 weeks of longwall panel
707 cycles
Average cycle time= 46.8 min
. .
· .
~ ·~
12/0l/20141l00
5 weeks of longwall panel
703 cycles
Average cycle time = 43.0 min
longwall as well as the formation of cavities. A large cavity has the potential to halt production for
periods in excess of 36 hours and can create harmful situations for operators. In addition, poor
performing roof supports will slow the overall mining operation by reducing the production rate.
By using analytical techniques, the Smart Solutions team can provide the mining crew
the proper guidance to manage, and more importantly, resolve, dangerous situations such
as the presence of failing roof cavities. Long-term data can help operations realize inherent
production improvements, ultimately resulting in a safer work environment—a key outcome
for every mining operator. Through cloud systems and edge-analytics, Komatsu is able to
improve the response time for notifications and alerts that are sent to mine personnel via
machine control or portable electronic devices.
4.3 Shear cycle optimization
Longwall systems can consist of approximately 210 roof supports with a face length in excess
of 430 m. Coal seam thickness can vary from 1.7 m to 7 m. The optimization of the roof supports’ lower, advance, set and shearer cycle speed provides data that allows process optimization through the Faceboss RS20s and ASA automation systems.
Figure 2 highlights data points from multiple shears. Data analytics shows that roof support set times are slower than the previous cycle by 15.5% when cavities are present on the
face.
Below, Figure 3 shows the results of a comparison between two consecutive longwall
blocks based on different levels of automation. By managing the extraction height and minimizing deviations, you can see that ASA provides advantages to mine operators from one
longwall block to the next. Aggregating data in the cloud is critical to allow Komatsu’s team
of prognostics engineers to implement complex data mining rules and utilize real-time data
streaming.
When automation engineers at the mine need to investigate parameter changes on
machines, they rely heavily on Komatsu’s data scientists and their analysis based on information gathered over many cycles.
Figure 4 below highlights results of investigations that have been concluded when shearer
speed is analyzed to determine the most optimum speed settings for mine cutting conditions.
Factors that influences the cutting conditions are strata pressure, coal hardness, drum design
to name only some of the factors. In this analysis the results demonstrate that operating at a
lower speed setting there is more variation that occurs across the face and with higher settings
the shearer will operate more consistently across the face.
It is important to note that analysis of automation parameters is continuously needed to
ensure that the best performance is achieved within the specific mine operating parameters.
Figure 2. Cycle time performance optimization.
• Cyde tim~ (m.n)CrewA
• (ydt t•mt(m•n)(rtw8
• Cyde time(mln)CrtwC
• C)'de timt(min)CrtwD
Cyde t1me(m1n)
C)'\k time(mln)Cr""'E
]: ao
+ Cvdetimr(mio)CrewF
~
! 70
~
• l'ydl> tlllll'(mln) AI:r=~lla
(a.,;ty
! "' jL-'---...,.;,.:--,c....,;;,I\
22/12/20130,00
tft)1}2014 0:00
\ \1hen a cavity is presenl on lhe fac.e cycle times are
on average 15.5% slower
1 - - - - - - - - - - - - - - - - -1
2tft)l/20141t00
5 weeks of longwall panel
707 cycles
Average cycle time= 46.8 min
. .
· .
~ ·~
12/0l/20141l00
5 weeks of longwall panel
703 cycles
Average cycle time = 43.0 min