

467
However, a very strong heteroscedastic behavior can be seen when both metallurgical models
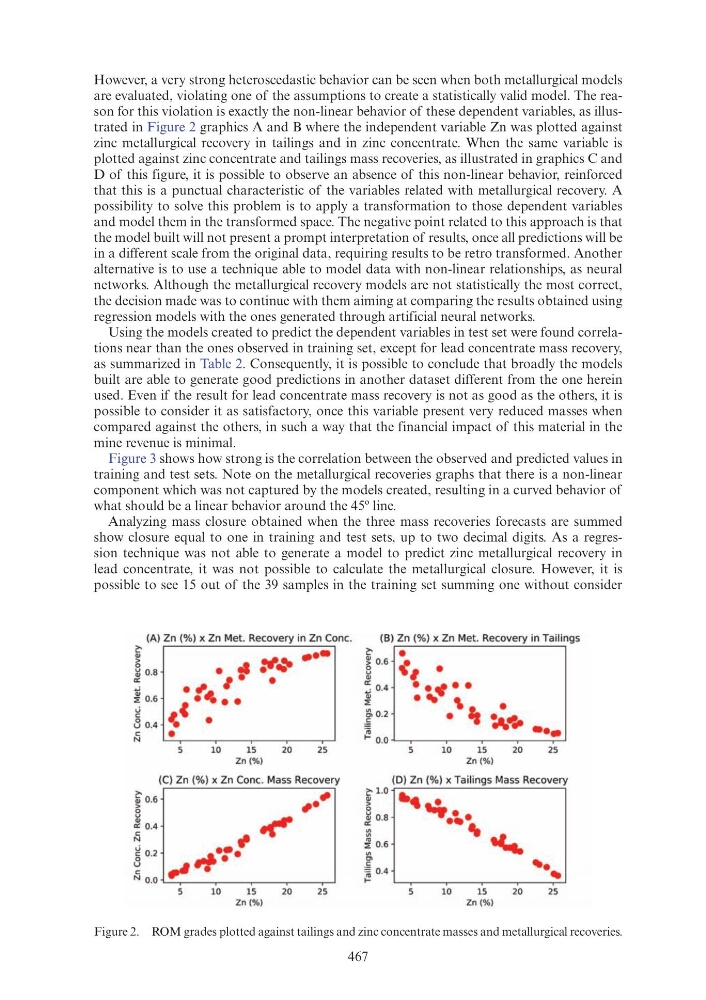
are evaluated, violating one of the assumptions to create a statistically valid model. The reason for this violation is exactly the non-linear behavior of these dependent variables, as illustrated in Figure 2 graphics A and B where the independent variable Zn was plotted against
zinc metallurgical recovery in tailings and in zinc concentrate. When the same variable is
plotted against zinc concentrate and tailings mass recoveries, as illustrated in graphics C and
D of this figure, it is possible to observe an absence of this non-linear behavior, reinforced
that this is a punctual characteristic of the variables related with metallurgical recovery. A
possibility to solve this problem is to apply a transformation to those dependent variables
and model them in the transformed space. The negative point related to this approach is that
the model built will not present a prompt interpretation of results, once all predictions will be
in a different scale from the original data, requiring results to be retro transformed. Another
alternative is to use a technique able to model data with non-linear relationships, as neural
networks. Although the metallurgical recovery models are not statistically the most correct,
the decision made was to continue with them aiming at comparing the results obtained using
regression models with the ones generated through artificial neural networks.
Using the models created to predict the dependent variables in test set were found correlations near than the ones observed in training set, except for lead concentrate mass recovery,
as summarized in Table 2. Consequently, it is possible to conclude that broadly the models
built are able to generate good predictions in another dataset different from the one herein
used. Even if the result for lead concentrate mass recovery is not as good as the others, it is
possible to consider it as satisfactory, once this variable present very reduced masses when
compared against the others, in such a way that the financial impact of this material in the
mine revenue is minimal.
Figure 3 shows how strong is the correlation between the observed and predicted values in
training and test sets. Note on the metallurgical recoveries graphs that there is a non-linear
component which was not captured by the models created, resulting in a curved behavior of
what should be a linear behavior around the 45º line.
Analyzing mass closure obtained when the three mass recoveries forecasts are summed
show closure equal to one in training and test sets, up to two decimal digits. As a regression technique was not able to generate a model to predict zinc metallurgical recovery in
lead concentrate, it was not possible to calculate the metallurgical closure. However, it is
possible to see 15 out of the 39 samples in the training set summing one without consider
Figure 2. ROM grades plotted against tailings and zinc concentrate masses and metallurgical recoveries.
(A) Zn (%) x Zn Met. Recovery in Zn Cone.
~
...
~
-· :1'-:e
:d 0 .8
•
: -
~
• , I
~ 0.6 • ·~ • •
8 0.4 (
•
~
.
10
15
Zn (% )
•
20
25
>ru o.6
>
0
u
(C) Zn (%) x Zn Cone. Mass Recovery
.f#
,
"
a: 0.4
<::
N
,
~ 0.2 . . . . , · : ·
N 0.0 i....C.....-----,-----,----.---......--J
10
15
Zn (%)
20
25
~
(B) Zn (%) x Zn Met. Recovery in Tail ings
•
~ 0 .6
0
u
"
a:
... 0.4
"
:;:
~ 1.0
QJ
>
0
~ 0.8
"' "'
~ 0.6
"'
(, .
.. ., ..
. .. \
. ,
10
15
Z n (%)
20
25
(D) Zn (%) x Tai lings Mass Recovery
••• .... '-• . .
~
-·
~ 0 .4
-
r
L-,---r--~--.....----~
10
15
Zn (%)
20
25
However, a very strong heteroscedastic behavior can be seen when both metallurgical models
are evaluated, violating one of the assumptions to create a statistically valid model. The reason for this violation is exactly the non-linear behavior of these dependent variables, as illustrated in Figure 2 graphics A and B where the independent variable Zn was plotted against
zinc metallurgical recovery in tailings and in zinc concentrate. When the same variable is
plotted against zinc concentrate and tailings mass recoveries, as illustrated in graphics C and
D of this figure, it is possible to observe an absence of this non-linear behavior, reinforced
that this is a punctual characteristic of the variables related with metallurgical recovery. A
possibility to solve this problem is to apply a transformation to those dependent variables
and model them in the transformed space. The negative point related to this approach is that
the model built will not present a prompt interpretation of results, once all predictions will be
in a different scale from the original data, requiring results to be retro transformed. Another
alternative is to use a technique able to model data with non-linear relationships, as neural
networks. Although the metallurgical recovery models are not statistically the most correct,
the decision made was to continue with them aiming at comparing the results obtained using
regression models with the ones generated through artificial neural networks.
Using the models created to predict the dependent variables in test set were found correlations near than the ones observed in training set, except for lead concentrate mass recovery,
as summarized in Table 2. Consequently, it is possible to conclude that broadly the models
built are able to generate good predictions in another dataset different from the one herein
used. Even if the result for lead concentrate mass recovery is not as good as the others, it is
possible to consider it as satisfactory, once this variable present very reduced masses when
compared against the others, in such a way that the financial impact of this material in the
mine revenue is minimal.
Figure 3 shows how strong is the correlation between the observed and predicted values in
training and test sets. Note on the metallurgical recoveries graphs that there is a non-linear
component which was not captured by the models created, resulting in a curved behavior of
what should be a linear behavior around the 45º line.
Analyzing mass closure obtained when the three mass recoveries forecasts are summed
show closure equal to one in training and test sets, up to two decimal digits. As a regression technique was not able to generate a model to predict zinc metallurgical recovery in
lead concentrate, it was not possible to calculate the metallurgical closure. However, it is
possible to see 15 out of the 39 samples in the training set summing one without consider
Figure 2. ROM grades plotted against tailings and zinc concentrate masses and metallurgical recoveries.
(A) Zn (%) x Zn Met. Recovery in Zn Cone.
~
...
~
-· :1'-:e
:d 0 .8
•
: -
~
• , I
~ 0.6 • ·~ • •
8 0.4 (
•
~
.
10
15
Zn (% )
•
20
25
>ru o.6
>
0
u
(C) Zn (%) x Zn Cone. Mass Recovery
.f#
,
"
a: 0.4
<::
N
,
~ 0.2 . . . . , · : ·
N 0.0 i....C.....-----,-----,----.---......--J
10
15
Zn (%)
20
25
~
(B) Zn (%) x Zn Met. Recovery in Tail ings
•
~ 0 .6
0
u
"
a:
... 0.4
"
:;:
~ 1.0
QJ
>
0
~ 0.8
"' "'
~ 0.6
"'
(, .
.. ., ..
. .. \
. ,
10
15
Z n (%)
20
25
(D) Zn (%) x Tai lings Mass Recovery
••• .... '-• . .
~
-·
~ 0 .4
-
r
L-,---r--~--.....----~
10
15
Zn (%)
20
25