

445
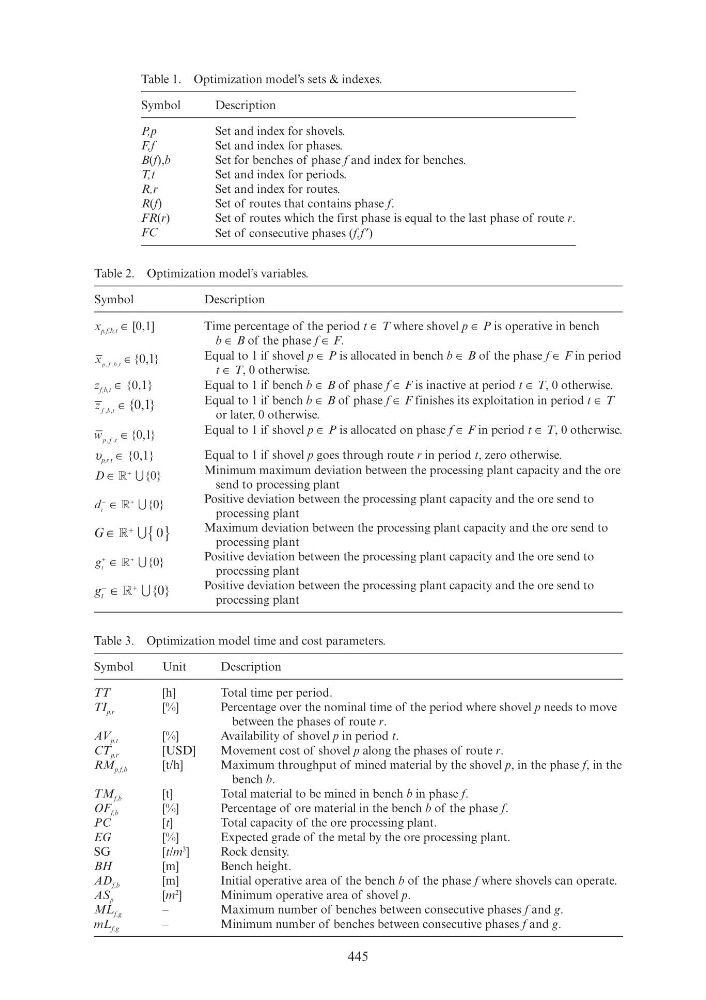
Table 1. Optimization model’s sets & indexes.
Symbol
Description
P,p
Set and index for shovels.
F,f
Set and index for phases.
B(f),b
Set for benches of phase f and index for benches.
T,t
Set and index for periods.
R,r
Set and index for routes.
R(f)
Set of routes that contains phase f.
FR(r)
Set of routes which the first phase is equal to the last phase of route r.
FC
Set of consecutive phases (f,f ′)
Table 2. Optimization model’s variables.
Symbol
Description
x p,f,b,t ∈ [0,1]
Time percentage of the period t ∈ T where shovel p ∈ P is operative in bench
b ∈ B of the phase f ∈ F.
x p f b t
,
f ,
{ , }
∈ 1
,
Equal to 1 if shovel p ∈ P is allocated in bench b ∈ B of the phase f ∈ F in period
t ∈ T, 0 otherwise.
z f,b,t ∈ {0,1}
Equal to 1 if bench b ∈ B of phase f ∈ F is inactive at period t ∈ T, 0 otherwise.
z f b t
,
b
{ , }
∈ 1
,
Equal to 1 if bench b ∈ B of phase f ∈ F finishes its exploitation in period t ∈ T
or later, 0 otherwise.
w p f t
,
f
{ , }
∈ 1
,
Equal to 1 if shovel p ∈ P is allocated on phase f ∈ F in period t ∈ T, 0 otherwise.
υ p,r,t ∈ {0,1}
Equal to 1 if shovel p goes through route r in period t, zero otherwise.
D ∈
+
R ∪ { }
Minimum maximum deviation between the processing plant capacity and the ore
send to processing plant
d t
d
−
+
∈ R ∪ { }
Positive deviation between the processing plant capacity and the ore send to
processing plant
G ∈
{ }
+
R ∪
Maximum deviation between the processing plant capacity and the ore send to
processing plant
g t
+
+
∈ R ∪ { }
Positive deviation between the processing plant capacity and the ore send to
processing plant
g t
−
+
∈ R ∪{ }
Positive deviation between the processing plant capacity and the ore send to
processing plant
Table 3. Optimization model time and cost parameters.
Symbol
Unit
Description
TT
[h]
Total time per period.
TI p,r
[%]
Percentage over the nominal time of the period where shovel p needs to move
between the phases of route r.
AV p,t
[%]
Availability of shovel p in period t.
CT p,r
[USD]
Movement cost of shovel p along the phases of route r.
RM p,f,b
[t/h]
Maximum throughput of mined material by the shovel p, in the phase f, in the
bench b.
TM f,b
[t]
Total material to be mined in bench b in phase f.
OF f,b
[%]
Percentage of ore material in the bench b of the phase f.
PC
[t]
Total capacity of the ore processing plant.
EG
[%]
Expected grade of the metal by the ore processing plant.
SG
[t/m
3 ]
Rock density.
BH
[m]
Bench height.
AD f,b
[m]
Initial operative area of the bench b of the phase f where shovels can operate.
AS p
[m
2 ]
Minimum operative area of shovel p.
ML f,g
–
Maximum number of benches between consecutive phases f and g.
mL f,g
–
Minimum number of benches between consecutive phases f and g.
Table 1. Optimization model’s sets & indexes.
Symbol
Description
P,p
Set and index for shovels.
F,f
Set and index for phases.
B(f),b
Set for benches of phase f and index for benches.
T,t
Set and index for periods.
R,r
Set and index for routes.
R(f)
Set of routes that contains phase f.
FR(r)
Set of routes which the first phase is equal to the last phase of route r.
FC
Set of consecutive phases (f,f ′)
Table 2. Optimization model’s variables.
Symbol
Description
x p,f,b,t ∈ [0,1]
Time percentage of the period t ∈ T where shovel p ∈ P is operative in bench
b ∈ B of the phase f ∈ F.
x p f b t
,
f ,
{ , }
∈ 1
,
Equal to 1 if shovel p ∈ P is allocated in bench b ∈ B of the phase f ∈ F in period
t ∈ T, 0 otherwise.
z f,b,t ∈ {0,1}
Equal to 1 if bench b ∈ B of phase f ∈ F is inactive at period t ∈ T, 0 otherwise.
z f b t
,
b
{ , }
∈ 1
,
Equal to 1 if bench b ∈ B of phase f ∈ F finishes its exploitation in period t ∈ T
or later, 0 otherwise.
w p f t
,
f
{ , }
∈ 1
,
Equal to 1 if shovel p ∈ P is allocated on phase f ∈ F in period t ∈ T, 0 otherwise.
υ p,r,t ∈ {0,1}
Equal to 1 if shovel p goes through route r in period t, zero otherwise.
D ∈
+
R ∪ { }
Minimum maximum deviation between the processing plant capacity and the ore
send to processing plant
d t
d
−
+
∈ R ∪ { }
Positive deviation between the processing plant capacity and the ore send to
processing plant
G ∈
{ }
+
R ∪
Maximum deviation between the processing plant capacity and the ore send to
processing plant
g t
+
+
∈ R ∪ { }
Positive deviation between the processing plant capacity and the ore send to
processing plant
g t
−
+
∈ R ∪{ }
Positive deviation between the processing plant capacity and the ore send to
processing plant
Table 3. Optimization model time and cost parameters.
Symbol
Unit
Description
TT
[h]
Total time per period.
TI p,r
[%]
Percentage over the nominal time of the period where shovel p needs to move
between the phases of route r.
AV p,t
[%]
Availability of shovel p in period t.
CT p,r
[USD]
Movement cost of shovel p along the phases of route r.
RM p,f,b
[t/h]
Maximum throughput of mined material by the shovel p, in the phase f, in the
bench b.
TM f,b
[t]
Total material to be mined in bench b in phase f.
OF f,b
[%]
Percentage of ore material in the bench b of the phase f.
PC
[t]
Total capacity of the ore processing plant.
EG
[%]
Expected grade of the metal by the ore processing plant.
SG
[t/m
3 ]
Rock density.
BH
[m]
Bench height.
AD f,b
[m]
Initial operative area of the bench b of the phase f where shovels can operate.
AS p
[m
2 ]
Minimum operative area of shovel p.
ML f,g
–
Maximum number of benches between consecutive phases f and g.
mL f,g
–
Minimum number of benches between consecutive phases f and g.