

374
Table 2. Processing plants parameters.
Parameters
Plant-1
Plant-2
Target production range (in kt/month)
142–157
807–892
Target iron (Fe%) range
60.5–63.5
60–62
Target silica (SiO2%) range
2–4
4–6
Target alumina (Al2O3%) range
3–5
3–5
Penalty cost for tonnage violation (in Rs/tonne)
150
150
Penalty cost for grade violation for Fe, Sio2 and Al2O3 (in Rs/tonne)
50
50
Table 3. Genetic algorithm’s parameters.
Parameters
Value
Number of chromosomes in the initial population
20
Crossover probability
0.9
Mutation probability
0.2
Table 4. Comparing genetic algorithm and CPLEX.
Characteristic
CPLEX
Genetic
algorithm
Gap
(in %)
Objective function value (in million rupees)
26.7
27.6
+3.41%
Computational time (in hours)
29.33
0.93
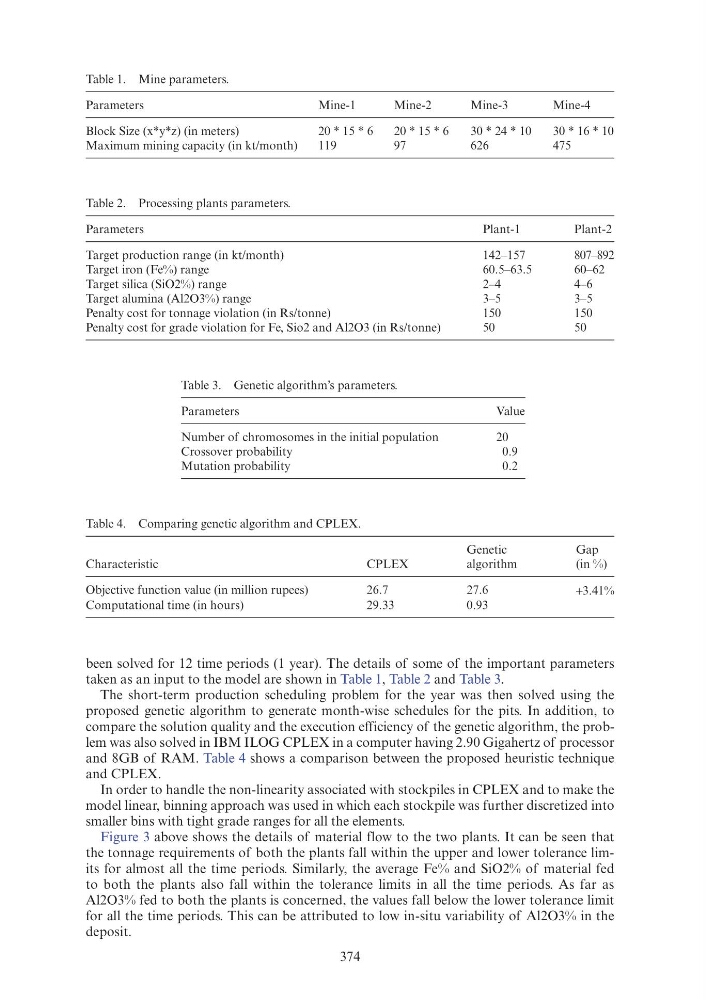
been solved for 12 time periods (1 year). The details of some of the important parameters
taken as an input to the model are shown in Table 1, Table 2 and Table 3.
The short-term production scheduling problem for the year was then solved using the
proposed genetic algorithm to generate month-wise schedules for the pits. In addition, to
compare the solution quality and the execution efficiency of the genetic algorithm, the problem was also solved in IBM ILOG CPLEX in a computer having 2.90 Gigahertz of processor
and 8GB of RAM. Table 4 shows a comparison between the proposed heuristic technique
and CPLEX.
In order to handle the non-linearity associated with stockpiles in CPLEX and to make the
model linear, binning approach was used in which each stockpile was further discretized into
smaller bins with tight grade ranges for all the elements.
Figure 3 above shows the details of material flow to the two plants. It can be seen that
the tonnage requirements of both the plants fall within the upper and lower tolerance limits for almost all the time periods. Similarly, the average Fe% and SiO2% of material fed
to both the plants also fall within the tolerance limits in all the time periods. As far as
Al2O3% fed to both the plants is concerned, the values fall below the lower tolerance limit
for all the time periods. This can be attributed to low in-situ variability of Al2O3% in the
deposit.
Table 1. Mine parameters.
Parameters
Mine-1
Mine-2
Mine-3
Mine-4
Block Size (x*y*z) (in meters)
20 * 15 * 6
20 * 15 * 6
30 * 24 * 10
30 * 16 * 10
Maximum mining capacity (in kt/month)
119
97
626
475
Table 2. Processing plants parameters.
Parameters
Plant-1
Plant-2
Target production range (in kt/month)
142–157
807–892
Target iron (Fe%) range
60.5–63.5
60–62
Target silica (SiO2%) range
2–4
4–6
Target alumina (Al2O3%) range
3–5
3–5
Penalty cost for tonnage violation (in Rs/tonne)
150
150
Penalty cost for grade violation for Fe, Sio2 and Al2O3 (in Rs/tonne)
50
50
Table 3. Genetic algorithm’s parameters.
Parameters
Value
Number of chromosomes in the initial population
20
Crossover probability
0.9
Mutation probability
0.2
Table 4. Comparing genetic algorithm and CPLEX.
Characteristic
CPLEX
Genetic
algorithm
Gap
(in %)
Objective function value (in million rupees)
26.7
27.6
+3.41%
Computational time (in hours)
29.33
0.93
been solved for 12 time periods (1 year). The details of some of the important parameters
taken as an input to the model are shown in Table 1, Table 2 and Table 3.
The short-term production scheduling problem for the year was then solved using the
proposed genetic algorithm to generate month-wise schedules for the pits. In addition, to
compare the solution quality and the execution efficiency of the genetic algorithm, the problem was also solved in IBM ILOG CPLEX in a computer having 2.90 Gigahertz of processor
and 8GB of RAM. Table 4 shows a comparison between the proposed heuristic technique
and CPLEX.
In order to handle the non-linearity associated with stockpiles in CPLEX and to make the
model linear, binning approach was used in which each stockpile was further discretized into
smaller bins with tight grade ranges for all the elements.
Figure 3 above shows the details of material flow to the two plants. It can be seen that
the tonnage requirements of both the plants fall within the upper and lower tolerance limits for almost all the time periods. Similarly, the average Fe% and SiO2% of material fed
to both the plants also fall within the tolerance limits in all the time periods. As far as
Al2O3% fed to both the plants is concerned, the values fall below the lower tolerance limit
for all the time periods. This can be attributed to low in-situ variability of Al2O3% in the
deposit.
Table 1. Mine parameters.
Parameters
Mine-1
Mine-2
Mine-3
Mine-4
Block Size (x*y*z) (in meters)
20 * 15 * 6
20 * 15 * 6
30 * 24 * 10
30 * 16 * 10
Maximum mining capacity (in kt/month)
119
97
626
475