

363
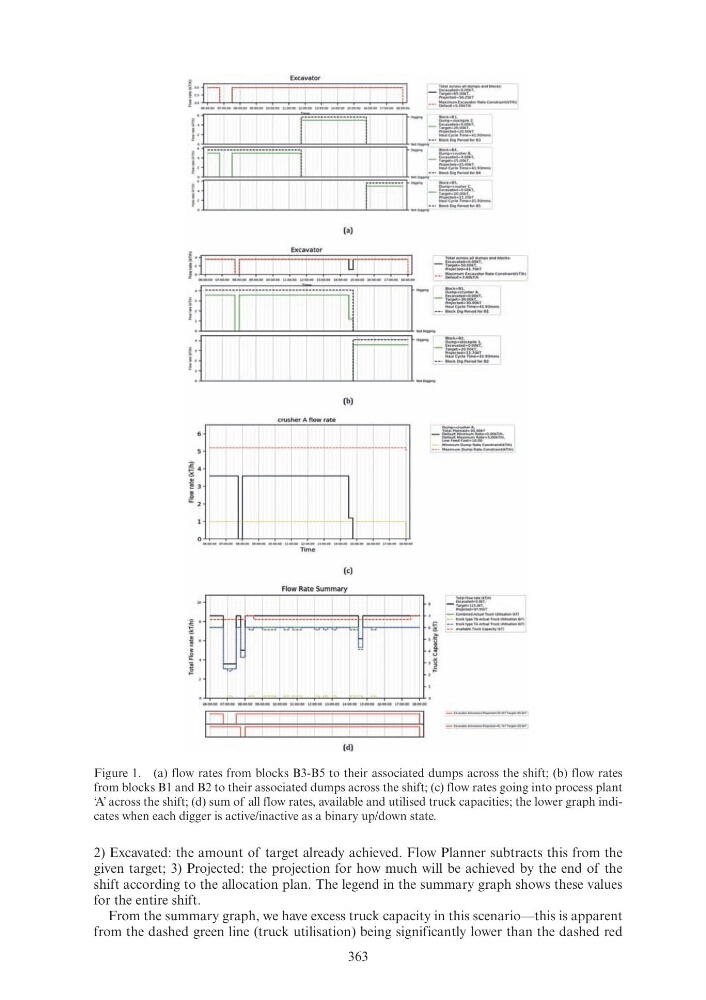
Figure 1. (a) flow rates from blocks B3-B5 to their associated dumps across the shift; (b) flow rates
from blocks B1 and B2 to their associated dumps across the shift; (c) flow rates going into process plant
‘A’ across the shift; (d) sum of all flow rates, available and utilised truck capacities; the lower graph indicates when each digger is active/inactive as a binary up/down state.
2) Excavated: the amount of target already achieved. Flow Planner subtracts this from the
given target; 3) Projected: the projection for how much will be achieved by the end of the
shift according to the allocation plan. The legend in the summary graph shows these values
for the entire shift.
From the summary graph, we have excess truck capacity in this scenario—this is apparent
from the dashed green line (truck utilisation) being significantly lower than the dashed red
(a)
(b)
crusher A flow rate
I
I I
r·--------------------------·r ·r ·---------------------,
-------J--lj---+-+--1
Time
(c)
Flow Rate Summary
..
I
I
I
0 ~ Cnn-nnnnnnj n r nnm'
·-· ---· ··--- _ ,._, r· -·
:
-
1 . .
[ ____
-
-
-
l _ _ _ I -
lotAI Fr- rato lkf lh)
- =:J!~r,1vr
- c-"""'"''""''""'' '-"M>t;o.,r•ll
:: E~. =~ ~?Ei:;~=~
O(i;O));OO 01:00:00 ot:OO:OO 1».00:00 10;00,00 11:00.00 ll:OO:OO ll:OO:OO 1<:00:00 JS:OO:OO 1.6:00:00 11:00.00 IUIO:OO
lsi
II
(d)
Figure 1. (a) flow rates from blocks B3-B5 to their associated dumps across the shift; (b) flow rates
from blocks B1 and B2 to their associated dumps across the shift; (c) flow rates going into process plant
‘A’ across the shift; (d) sum of all flow rates, available and utilised truck capacities; the lower graph indicates when each digger is active/inactive as a binary up/down state.
2) Excavated: the amount of target already achieved. Flow Planner subtracts this from the
given target; 3) Projected: the projection for how much will be achieved by the end of the
shift according to the allocation plan. The legend in the summary graph shows these values
for the entire shift.
From the summary graph, we have excess truck capacity in this scenario—this is apparent
from the dashed green line (truck utilisation) being significantly lower than the dashed red
(a)
(b)
crusher A flow rate
I
I I
r·--------------------------·r ·r ·---------------------,
-------J--lj---+-+--1
Time
(c)
Flow Rate Summary
..
I
I
I
0 ~ Cnn-nnnnnnj n r nnm'
·-· ---· ··--- _ ,._, r· -·
:
-
1 . .
[ ____
-
-
-
l _ _ _ I -
lotAI Fr- rato lkf lh)
- =:J!~r,1vr
- c-"""'"''""''""'' '-"M>t;o.,r•ll
:: E~. =~ ~?Ei:;~=~
O(i;O));OO 01:00:00 ot:OO:OO 1».00:00 10;00,00 11:00.00 ll:OO:OO ll:OO:OO 1<:00:00 JS:OO:OO 1.6:00:00 11:00.00 IUIO:OO
lsi
II
(d)