

342
approach was maintained through the project studies, with the corresponding cut-off grades
identified as follows:
• 5.0 g/t au in the first seven years (stopes below 5 g/t are excluded from the mine plans)
• 3.0 g/t au for the remainder of mine life (all profitable stopes are included)
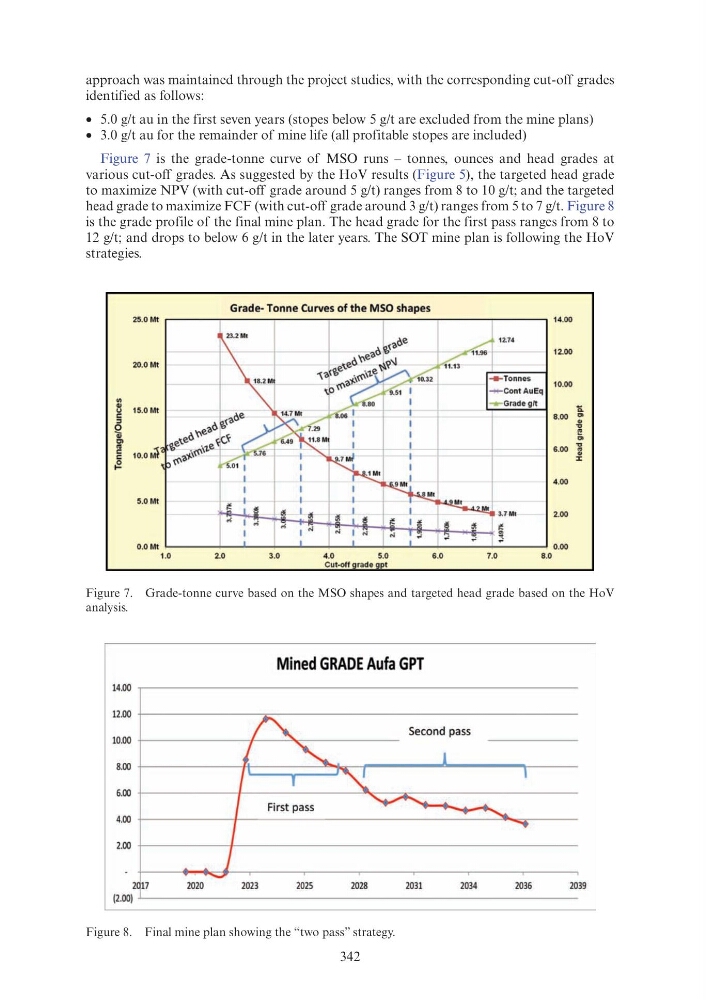
Figure 7 is the grade-tonne curve of MSO runs – tonnes, ounces and head grades at
various cut-off grades. As suggested by the HoV results (Figure 5), the targeted head grade
to maximize NPV (with cut-off grade around 5 g/t) ranges from 8 to 10 g/t; and the targeted
head grade to maximize FCF (with cut-off grade around 3 g/t) ranges from 5 to 7 g/t. Figure 8
is the grade profile of the final mine plan. The head grade for the first pass ranges from 8 to
12 g/t; and drops to below 6 g/t in the later years. The SOT mine plan is following the HoV
strategies.
Figure 7. Grade-tonne curve based on the MSO shapes and targeted head grade based on the HoV
analysis.
Figure 8. Final mine plan showing the “two pass” strategy.
25.0 Mt
14 .00
12.00
20.0 Mt
10.00
C/l
"' 15.0 Mt
15.
u
"
8.00 0>
:I
"
0
"0
Ql
I"
Cl
0>
"' 10.0 M1
6 .00 ~
"
"
I
~
4 .00
5.0 Mt
2.00
0.0 Mt
0.00
1.0
2.0
3.0
4.0
5.0
6 .0
7.0
8 .0
Cut-off rade
t
Mined GRADE Aufa GPT
14.00
A
Second pass
I
'
l
I
I
~
1
I
~
Fi rst pass
......
,.. ..........
I
...
J
12.00
10.00
8.00
6.00
4.00
2.00
~
2017
2020
2023
2025
2028
2031
2034
2036
2039
(2.00) . L _ _ _ _ _ _ _ _ _ _ _ _ _ _ _ _ _ _ _ _ _ _ _ _ _ _ _ _ _
approach was maintained through the project studies, with the corresponding cut-off grades
identified as follows:
• 5.0 g/t au in the first seven years (stopes below 5 g/t are excluded from the mine plans)
• 3.0 g/t au for the remainder of mine life (all profitable stopes are included)
Figure 7 is the grade-tonne curve of MSO runs – tonnes, ounces and head grades at
various cut-off grades. As suggested by the HoV results (Figure 5), the targeted head grade
to maximize NPV (with cut-off grade around 5 g/t) ranges from 8 to 10 g/t; and the targeted
head grade to maximize FCF (with cut-off grade around 3 g/t) ranges from 5 to 7 g/t. Figure 8
is the grade profile of the final mine plan. The head grade for the first pass ranges from 8 to
12 g/t; and drops to below 6 g/t in the later years. The SOT mine plan is following the HoV
strategies.
Figure 7. Grade-tonne curve based on the MSO shapes and targeted head grade based on the HoV
analysis.
Figure 8. Final mine plan showing the “two pass” strategy.
25.0 Mt
14 .00
12.00
20.0 Mt
10.00
C/l
"' 15.0 Mt
15.
u
"
8.00 0>
:I
"
0
"0
Ql
I"
Cl
0>
"' 10.0 M1
6 .00 ~
"
"
I
~
4 .00
5.0 Mt
2.00
0.0 Mt
0.00
1.0
2.0
3.0
4.0
5.0
6 .0
7.0
8 .0
Cut-off rade
t
Mined GRADE Aufa GPT
14.00
A
Second pass
I
'
l
I
I
~
1
I
~
Fi rst pass
......
,.. ..........
I
...
J
12.00
10.00
8.00
6.00
4.00
2.00
~
2017
2020
2023
2025
2028
2031
2034
2036
2039
(2.00) . L _ _ _ _ _ _ _ _ _ _ _ _ _ _ _ _ _ _ _ _ _ _ _ _ _ _ _ _ _