

259
centroid and pit exit coordinates, while distance between pit exit and final dump were used
to calculate outside pit haulage cost. Blocks schedule considers the first 10 years period of
production and waste handling, sequenced yearly for each of the five scenarios analyzed.
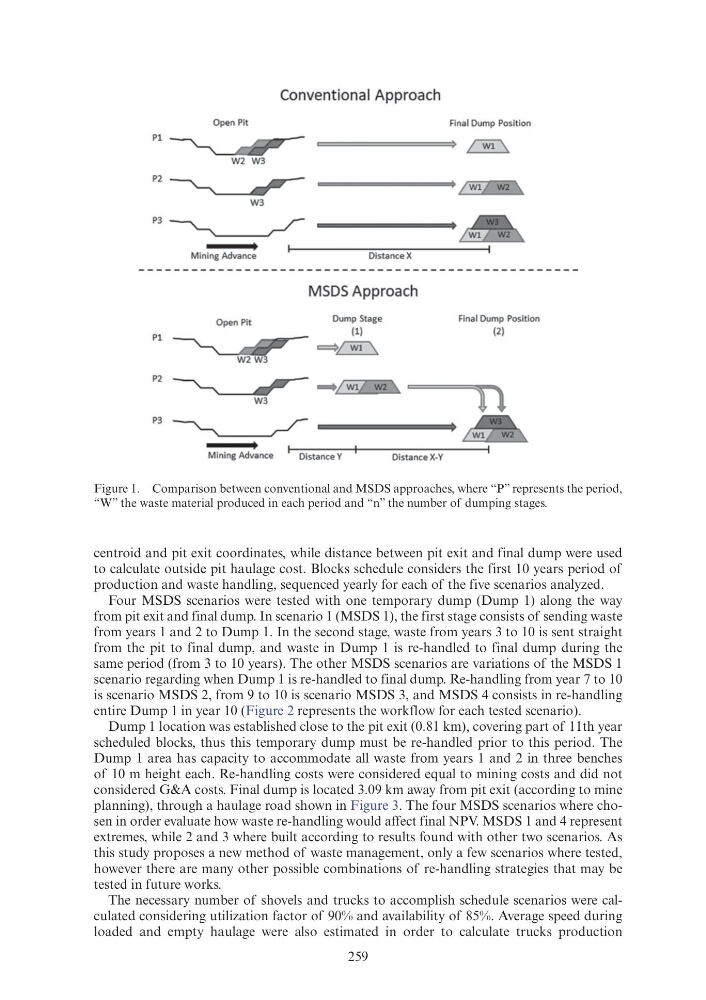
Four MSDS scenarios were tested with one temporary dump (Dump 1) along the way
from pit exit and final dump. In scenario 1 (MSDS 1), the first stage consists of sending waste
from years 1 and 2 to Dump 1. In the second stage, waste from years 3 to 10 is sent straight
from the pit to final dump, and waste in Dump 1 is re-handled to final dump during the
same period (from 3 to 10 years). The other MSDS scenarios are variations of the MSDS 1
scenario regarding when Dump 1 is re-handled to final dump. Re-handling from year 7 to 10
is scenario MSDS 2, from 9 to 10 is scenario MSDS 3, and MSDS 4 consists in re-handling
entire Dump 1 in year 10 (Figure 2 represents the workflow for each tested scenario).
Dump 1 location was established close to the pit exit (0.81 km), covering part of 11th year
scheduled blocks, thus this temporary dump must be re-handled prior to this period. The
Dump 1 area has capacity to accommodate all waste from years 1 and 2 in three benches
of 10 m height each. Re-handling costs were considered equal to mining costs and did not
considered G&A costs. Final dump is located 3.09 km away from pit exit (according to mine
planning), through a haulage road shown in Figure 3. The four MSDS scenarios where chosen in order evaluate how waste re-handling would affect final NPV. MSDS 1 and 4 represent
extremes, while 2 and 3 where built according to results found with other two scenarios. As
this study proposes a new method of waste management, only a few scenarios where tested,
however there are many other possible combinations of re-handling strategies that may be
tested in future works.
The necessary number of shovels and trucks to accomplish schedule scenarios were calculated considering utilization factor of 90% and availability of 85%. Average speed during
loaded and empty haulage were also estimated in order to calculate trucks production
Figure 1. Comparison between conventional and MSDS approaches, where “P” represents the period,
“W” the waste material produced in each period and “n” the number of dumping stages.
Conventional Approach
Open Pit
Pl
P2~
W3
Mining Advance
Open Pit
Pl
MSDS Approach
Dump Stage
(1)
~~
P2~
W3
Mining Advance
Distance Y
Distance X-Y
Final Dump Position
Final Dump Position
(2)
ll
centroid and pit exit coordinates, while distance between pit exit and final dump were used
to calculate outside pit haulage cost. Blocks schedule considers the first 10 years period of
production and waste handling, sequenced yearly for each of the five scenarios analyzed.
Four MSDS scenarios were tested with one temporary dump (Dump 1) along the way
from pit exit and final dump. In scenario 1 (MSDS 1), the first stage consists of sending waste
from years 1 and 2 to Dump 1. In the second stage, waste from years 3 to 10 is sent straight
from the pit to final dump, and waste in Dump 1 is re-handled to final dump during the
same period (from 3 to 10 years). The other MSDS scenarios are variations of the MSDS 1
scenario regarding when Dump 1 is re-handled to final dump. Re-handling from year 7 to 10
is scenario MSDS 2, from 9 to 10 is scenario MSDS 3, and MSDS 4 consists in re-handling
entire Dump 1 in year 10 (Figure 2 represents the workflow for each tested scenario).
Dump 1 location was established close to the pit exit (0.81 km), covering part of 11th year
scheduled blocks, thus this temporary dump must be re-handled prior to this period. The
Dump 1 area has capacity to accommodate all waste from years 1 and 2 in three benches
of 10 m height each. Re-handling costs were considered equal to mining costs and did not
considered G&A costs. Final dump is located 3.09 km away from pit exit (according to mine
planning), through a haulage road shown in Figure 3. The four MSDS scenarios where chosen in order evaluate how waste re-handling would affect final NPV. MSDS 1 and 4 represent
extremes, while 2 and 3 where built according to results found with other two scenarios. As
this study proposes a new method of waste management, only a few scenarios where tested,
however there are many other possible combinations of re-handling strategies that may be
tested in future works.
The necessary number of shovels and trucks to accomplish schedule scenarios were calculated considering utilization factor of 90% and availability of 85%. Average speed during
loaded and empty haulage were also estimated in order to calculate trucks production
Figure 1. Comparison between conventional and MSDS approaches, where “P” represents the period,
“W” the waste material produced in each period and “n” the number of dumping stages.
Conventional Approach
Open Pit
Pl
P2~
W3
Mining Advance
Open Pit
Pl
MSDS Approach
Dump Stage
(1)
~~
P2~
W3
Mining Advance
Distance Y
Distance X-Y
Final Dump Position
Final Dump Position
(2)
ll