

141
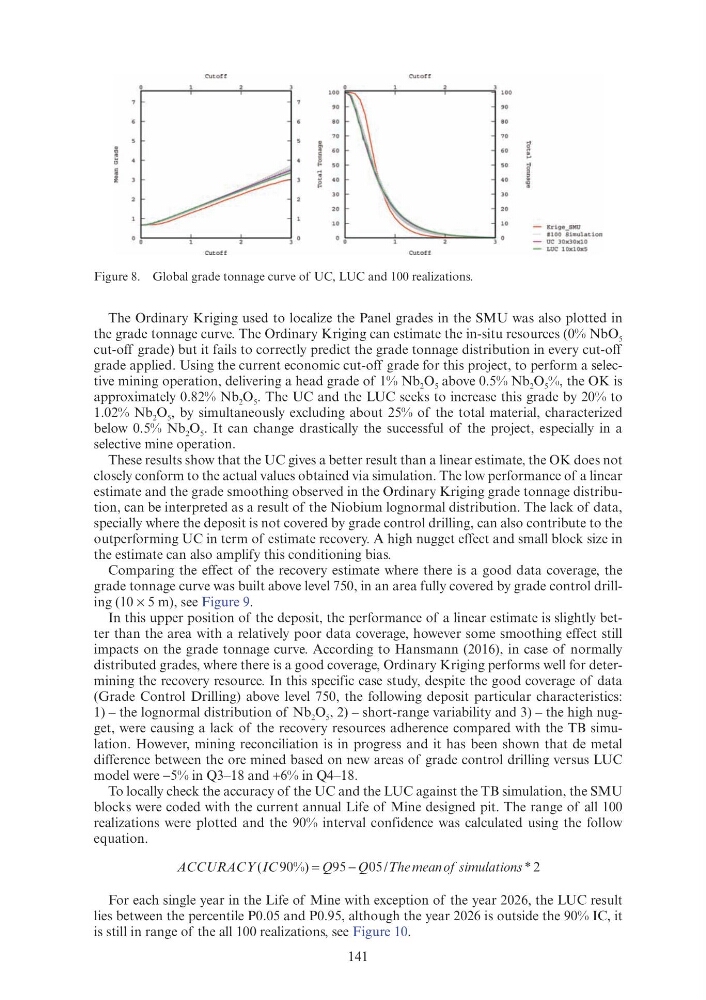
The Ordinary Kriging used to localize the Panel grades in the SMU was also plotted in
the grade tonnage curve. The Ordinary Kriging can estimate the in-situ resources (0% NbO 5
cut-off grade) but it fails to correctly predict the grade tonnage distribution in every cut-off
grade applied. Using the current economic cut-off grade for this project, to perform a selective mining operation, delivering a head grade of 1% Nb 2 O 5 above 0.5% Nb 2 O 5 %, the OK is
approximately 0.82% Nb 2 O 5 . The UC and the LUC seeks to increase this grade by 20% to
1.02% Nb 2 O 5 , by simultaneously excluding about 25% of the total material, characterized
below 0.5% Nb 2 O 5 . It can change drastically the successful of the project, especially in a
selective mine operation.
These results show that the UC gives a better result than a linear estimate, the OK does not
closely conform to the actual values obtained via simulation. The low performance of a linear
estimate and the grade smoothing observed in the Ordinary Kriging grade tonnage distribution, can be interpreted as a result of the Niobium lognormal distribution. The lack of data,
specially where the deposit is not covered by grade control drilling, can also contribute to the
outperforming UC in term of estimate recovery. A high nugget effect and small block size in
the estimate can also amplify this conditioning bias.
Comparing the effect of the recovery estimate where there is a good data coverage, the
grade tonnage curve was built above level 750, in an area fully covered by grade control drilling (10 × 5 m), see Figure 9.
In this upper position of the deposit, the performance of a linear estimate is slightly better than the area with a relatively poor data coverage, however some smoothing effect still
impacts on the grade tonnage curve. According to Hansmann (2016), in case of normally
distributed grades, where there is a good coverage, Ordinary Kriging performs well for determining the recovery resource. In this specific case study, despite the good coverage of data
(Grade Control Drilling) above level 750, the following deposit particular characteristics:
1) – the lognormal distribution of Nb 2 O 5 , 2) – short-range variability and 3) – the high nugget, were causing a lack of the recovery resources adherence compared with the TB simulation. However, mining reconciliation is in progress and it has been shown that de metal
difference between the ore mined based on new areas of grade control drilling versus LUC
model were −5% in Q3–18 and +6% in Q4–18.
To locally check the accuracy of the UC and the LUC against the TB simulation, the SMU
blocks were coded with the current annual Life of Mine designed pit. The range of all 100
realizations were plotted and the 90% interval confidence was calculated using the follow
equation.
ACCURACY
The meanof s
o imulations
(
%
IC
)
/
Q
Q
* 2
Q
For each single year in the Life of Mine with exception of the year 2026, the LUC result
lies between the percentile P0.05 and P0.95, although the year 2026 is outside the 90% IC, it
is still in range of the all 100 realizations, see Figure 10.
Figure 8. Global grade tonnage curve of UC, LUC and 100 realizations.
Cutoff
Cutoff
"0
"'
80
.
~
~
I 50
50
I
. 40
40
g
30
30
- Krige_ SMU
#100 Simu lation
- UC 30x30xl 0
Cu tof f
Cutoff
- LUC 10x 10x5
The Ordinary Kriging used to localize the Panel grades in the SMU was also plotted in
the grade tonnage curve. The Ordinary Kriging can estimate the in-situ resources (0% NbO 5
cut-off grade) but it fails to correctly predict the grade tonnage distribution in every cut-off
grade applied. Using the current economic cut-off grade for this project, to perform a selective mining operation, delivering a head grade of 1% Nb 2 O 5 above 0.5% Nb 2 O 5 %, the OK is
approximately 0.82% Nb 2 O 5 . The UC and the LUC seeks to increase this grade by 20% to
1.02% Nb 2 O 5 , by simultaneously excluding about 25% of the total material, characterized
below 0.5% Nb 2 O 5 . It can change drastically the successful of the project, especially in a
selective mine operation.
These results show that the UC gives a better result than a linear estimate, the OK does not
closely conform to the actual values obtained via simulation. The low performance of a linear
estimate and the grade smoothing observed in the Ordinary Kriging grade tonnage distribution, can be interpreted as a result of the Niobium lognormal distribution. The lack of data,
specially where the deposit is not covered by grade control drilling, can also contribute to the
outperforming UC in term of estimate recovery. A high nugget effect and small block size in
the estimate can also amplify this conditioning bias.
Comparing the effect of the recovery estimate where there is a good data coverage, the
grade tonnage curve was built above level 750, in an area fully covered by grade control drilling (10 × 5 m), see Figure 9.
In this upper position of the deposit, the performance of a linear estimate is slightly better than the area with a relatively poor data coverage, however some smoothing effect still
impacts on the grade tonnage curve. According to Hansmann (2016), in case of normally
distributed grades, where there is a good coverage, Ordinary Kriging performs well for determining the recovery resource. In this specific case study, despite the good coverage of data
(Grade Control Drilling) above level 750, the following deposit particular characteristics:
1) – the lognormal distribution of Nb 2 O 5 , 2) – short-range variability and 3) – the high nugget, were causing a lack of the recovery resources adherence compared with the TB simulation. However, mining reconciliation is in progress and it has been shown that de metal
difference between the ore mined based on new areas of grade control drilling versus LUC
model were −5% in Q3–18 and +6% in Q4–18.
To locally check the accuracy of the UC and the LUC against the TB simulation, the SMU
blocks were coded with the current annual Life of Mine designed pit. The range of all 100
realizations were plotted and the 90% interval confidence was calculated using the follow
equation.
ACCURACY
The meanof s
o imulations
(
%
IC
)
/
Q
Q
* 2
Q
For each single year in the Life of Mine with exception of the year 2026, the LUC result
lies between the percentile P0.05 and P0.95, although the year 2026 is outside the 90% IC, it
is still in range of the all 100 realizations, see Figure 10.
Figure 8. Global grade tonnage curve of UC, LUC and 100 realizations.
Cutoff
Cutoff
"0
"'
80
.
~
~
I 50
50
I
. 40
40
g
30
30
- Krige_ SMU
#100 Simu lation
- UC 30x30xl 0
Cu tof f
Cutoff
- LUC 10x 10x5