

128
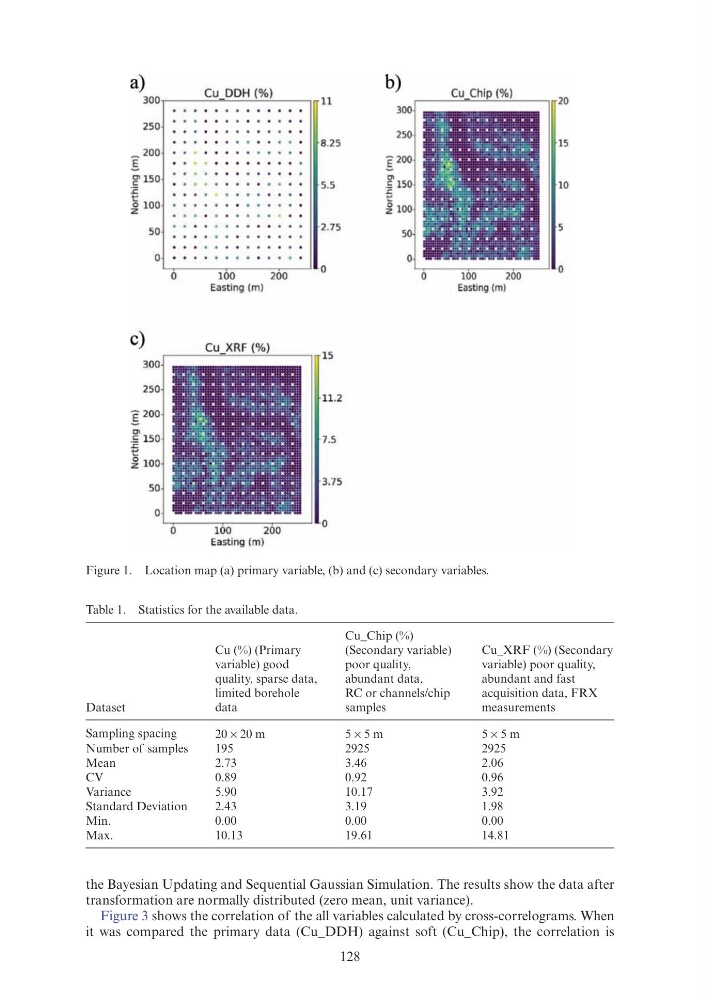
Figure 1. Location map (a) primary variable, (b) and (c) secondary variables.
Table 1. Statistics for the available data.
Dataset
Cu (%) (Primary
variable) good
quality, sparse data,
limited borehole
data
Cu_Chip (%)
(Secondary variable)
poor quality,
abundant data,
RC or channels/chip
samples
Cu_XRF (%) (Secondary
variable) poor quality,
abundant and fast
acquisition data, FRX
measurements
Sampling spacing
20 × 20 m
5 × 5 m
5 × 5 m
Number of samples
195
2925
2925
Mean
2.73
3.46
2.06
CV
0.89
0.92
0.96
Variance
5.90
10.17
3.92
Standard Deviation
2.43
3.19
1.98
Min.
0.00
0.00
0.00
Max.
10.13
19.61
14.81
the Bayesian Updating and Sequential Gaussian Simulation. The results show the data after
transformation are normally distributed (zero mean, unit variance).
Figure 3 shows the correlation of the all variables calculated by cross-correlograms. When
it was compared the primary data (Cu_DDH) against soft (Cu_Chip), the correlation is
a)
Cu DDH (%)
b)
Cu_Chip (%)
300
11
20
300
250 .. . .. .
250
8.25
15
-200
"E 2oo
E
g' 150
01
5.5
·" 150
10
:c
.c
t::
t
~ 100
~ 100
50
2.75
so
0 .
0
0
100
200
0
0
100
200
0
Easting (m)
Easting (m)
c)
Cu_XRF (%)
15
300
250
11.2
:g 200
Ol
·= 150
~
7 .5
~ 100
50
3.75
0
0
100
200
0
Easting (m)
a)
0.20
0.15
~
c::
~ 0.10
C1'
~
c)
~
c::
0.05
0.00
-4
0.20
0.15
~ 0.10
C1'
~
u.
0.05
0.00
-4
a)
Histogram Nscore Cu DDH (%)
n = 195
nrrlm =292q m=
a=
_nf
~
-2
0
2
Cu_DDH (%)
Histogram Nscore Cu XRF (%)
-rf
-2
rr-
-
r0
Cu_XRF (%)
n= 2925
nuim = 19q
m=
a =
rrh
2
Cross correlogram
(Cu_DDH x Cu_Chip)
4
4
b)
,.,
u
c::
0.20
0.15
~ 0.10
C1'
~
u.
b)
0.05
0.00
-4
0.9
0.8
1: 0.7
-8 0.6
~ 0.5
~ 0.4
u 0.3
0.2
0.1
Hist ogram Nscore Cu Ch ip (%)
rr-
r-rf
- 2
0
Cu_Chip (%)
Crosscorre logram
{Cu_DDH x Cu_XRF)
n = 2jl2S
nrr/m ~~6
a=1
rh
s ro B w ~ ~ ~ ~ ~ ~
Distance (meters)
4
Figure 1. Location map (a) primary variable, (b) and (c) secondary variables.
Table 1. Statistics for the available data.
Dataset
Cu (%) (Primary
variable) good
quality, sparse data,
limited borehole
data
Cu_Chip (%)
(Secondary variable)
poor quality,
abundant data,
RC or channels/chip
samples
Cu_XRF (%) (Secondary
variable) poor quality,
abundant and fast
acquisition data, FRX
measurements
Sampling spacing
20 × 20 m
5 × 5 m
5 × 5 m
Number of samples
195
2925
2925
Mean
2.73
3.46
2.06
CV
0.89
0.92
0.96
Variance
5.90
10.17
3.92
Standard Deviation
2.43
3.19
1.98
Min.
0.00
0.00
0.00
Max.
10.13
19.61
14.81
the Bayesian Updating and Sequential Gaussian Simulation. The results show the data after
transformation are normally distributed (zero mean, unit variance).
Figure 3 shows the correlation of the all variables calculated by cross-correlograms. When
it was compared the primary data (Cu_DDH) against soft (Cu_Chip), the correlation is
a)
Cu DDH (%)
b)
Cu_Chip (%)
300
11
20
300
250 .. . .. .
250
8.25
15
-200
"E 2oo
E
g' 150
01
5.5
·" 150
10
:c
.c
t::
t
~ 100
~ 100
50
2.75
so
0 .
0
0
100
200
0
0
100
200
0
Easting (m)
Easting (m)
c)
Cu_XRF (%)
15
300
250
11.2
:g 200
Ol
·= 150
~
7 .5
~ 100
50
3.75
0
0
100
200
0
Easting (m)
a)
0.20
0.15
~
c::
~ 0.10
C1'
~
c)
~
c::
0.05
0.00
-4
0.20
0.15
~ 0.10
C1'
~
u.
0.05
0.00
-4
a)
Histogram Nscore Cu DDH (%)
n = 195
nrrlm =292q m=
a=
_nf
~
-2
0
2
Cu_DDH (%)
Histogram Nscore Cu XRF (%)
-rf
-2
rr-
-
r0
Cu_XRF (%)
n= 2925
nuim = 19q
m=
a =
rrh
2
Cross correlogram
(Cu_DDH x Cu_Chip)
4
4
b)
,.,
u
c::
0.20
0.15
~ 0.10
C1'
~
u.
b)
0.05
0.00
-4
0.9
0.8
1: 0.7
-8 0.6
~ 0.5
~ 0.4
u 0.3
0.2
0.1
Hist ogram Nscore Cu Ch ip (%)
rr-
r-rf
- 2
0
Cu_Chip (%)
Crosscorre logram
{Cu_DDH x Cu_XRF)
n = 2jl2S
nrr/m ~~6
a=1
rh
s ro B w ~ ~ ~ ~ ~ ~
Distance (meters)
4