

103
3 METHOD
In this study the three machine learning methods autoencoder, SVM and k-means were used
to classify the 2 m intervals in three different tests based on different training data. These
methods were done as semi-supervised training, supervised training and clustering without
training data respectively. Due to the small dataset 90% of the points were used for training
and the remainder for testing. The tests were repeated ten times, each time using a different
10% of the data for testing.
The Test 1 used the mineral groups to classify each interval as either WA or NM. For each
2m interval the percentages of each mineral group were used as the inputs and the lithology
the output. 207 of these intervals were labelled as either WA (106) or NM (101). Only these
intervals with a ground truth were used in the training and testing.
Test 2 used the geochemical assays to classify the intervals as shale, BIF or ore. The ten
dominant geochemical species (Fe, Al 2 O 3 , P, SiO 2 , Mn, MgO, K2O, TiO 2 , S and LOI) were
used as the inputs. Only 136 data points contained both assays and labels. SVM was not used
in this test as it is optimised for two categories and cannot be directly applied to separate
these three classes.
Test 3 used the same ten geochemical assays for the 207 data points from Test 2; however
this time the aim was to classify the intervals as either WA or NM.
4 RESULTS AND DISCUSSION
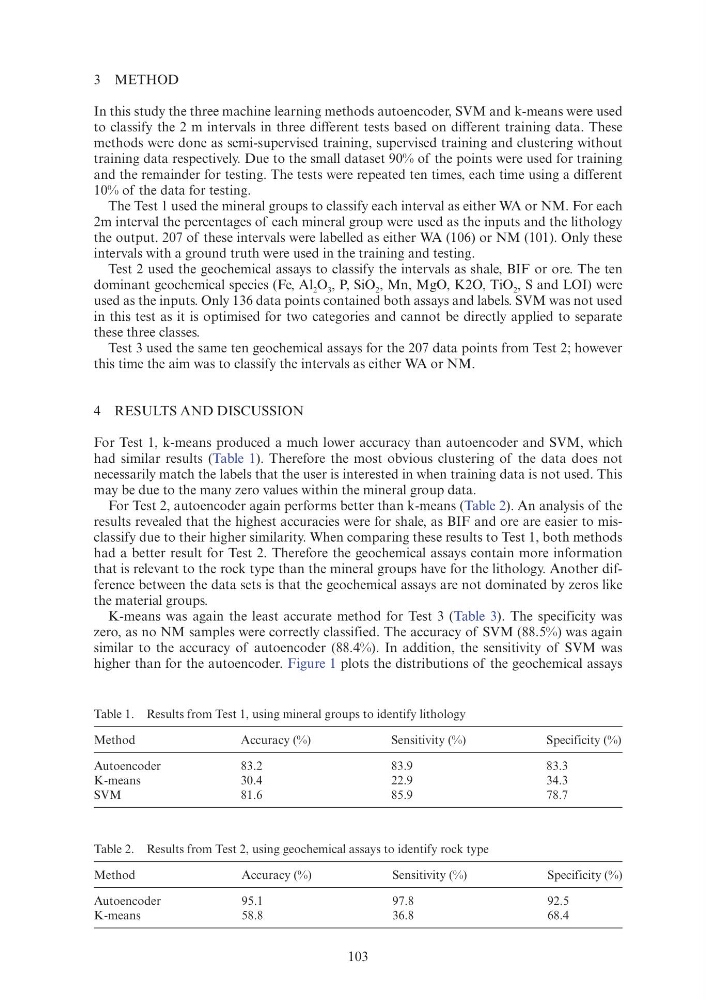
For Test 1, k-means produced a much lower accuracy than autoencoder and SVM, which
had similar results (Table 1). Therefore the most obvious clustering of the data does not
necessarily match the labels that the user is interested in when training data is not used. This
may be due to the many zero values within the mineral group data.
For Test 2, autoencoder again performs better than k-means (Table 2). An analysis of the
results revealed that the highest accuracies were for shale, as BIF and ore are easier to misclassify due to their higher similarity. When comparing these results to Test 1, both methods
had a better result for Test 2. Therefore the geochemical assays contain more information
that is relevant to the rock type than the mineral groups have for the lithology. Another difference between the data sets is that the geochemical assays are not dominated by zeros like
the material groups.
K-means was again the least accurate method for Test 3 (Table 3). The specificity was
zero, as no NM samples were correctly classified. The accuracy of SVM (88.5%) was again
similar to the accuracy of autoencoder (88.4%). In addition, the sensitivity of SVM was
higher than for the autoencoder. Figure 1 plots the distributions of the geochemical assays
Table 1. Results from Test 1, using mineral groups to identify lithology
Method
Accuracy (%)
Sensitivity (%)
Specificity (%)
Autoencoder
83.2
83.9
83.3
K-means
30.4
22.9
34.3
SVM
81.6
85.9
78.7
Table 2. Results from Test 2, using geochemical assays to identify rock type
Method
Accuracy (%)
Sensitivity (%)
Specificity (%)
Autoencoder
95.1
97.8
92.5
K-means
58.8
36.8
68.4
3 METHOD
In this study the three machine learning methods autoencoder, SVM and k-means were used
to classify the 2 m intervals in three different tests based on different training data. These
methods were done as semi-supervised training, supervised training and clustering without
training data respectively. Due to the small dataset 90% of the points were used for training
and the remainder for testing. The tests were repeated ten times, each time using a different
10% of the data for testing.
The Test 1 used the mineral groups to classify each interval as either WA or NM. For each
2m interval the percentages of each mineral group were used as the inputs and the lithology
the output. 207 of these intervals were labelled as either WA (106) or NM (101). Only these
intervals with a ground truth were used in the training and testing.
Test 2 used the geochemical assays to classify the intervals as shale, BIF or ore. The ten
dominant geochemical species (Fe, Al 2 O 3 , P, SiO 2 , Mn, MgO, K2O, TiO 2 , S and LOI) were
used as the inputs. Only 136 data points contained both assays and labels. SVM was not used
in this test as it is optimised for two categories and cannot be directly applied to separate
these three classes.
Test 3 used the same ten geochemical assays for the 207 data points from Test 2; however
this time the aim was to classify the intervals as either WA or NM.
4 RESULTS AND DISCUSSION
For Test 1, k-means produced a much lower accuracy than autoencoder and SVM, which
had similar results (Table 1). Therefore the most obvious clustering of the data does not
necessarily match the labels that the user is interested in when training data is not used. This
may be due to the many zero values within the mineral group data.
For Test 2, autoencoder again performs better than k-means (Table 2). An analysis of the
results revealed that the highest accuracies were for shale, as BIF and ore are easier to misclassify due to their higher similarity. When comparing these results to Test 1, both methods
had a better result for Test 2. Therefore the geochemical assays contain more information
that is relevant to the rock type than the mineral groups have for the lithology. Another difference between the data sets is that the geochemical assays are not dominated by zeros like
the material groups.
K-means was again the least accurate method for Test 3 (Table 3). The specificity was
zero, as no NM samples were correctly classified. The accuracy of SVM (88.5%) was again
similar to the accuracy of autoencoder (88.4%). In addition, the sensitivity of SVM was
higher than for the autoencoder. Figure 1 plots the distributions of the geochemical assays
Table 1. Results from Test 1, using mineral groups to identify lithology
Method
Accuracy (%)
Sensitivity (%)
Specificity (%)
Autoencoder
83.2
83.9
83.3
K-means
30.4
22.9
34.3
SVM
81.6
85.9
78.7
Table 2. Results from Test 2, using geochemical assays to identify rock type
Method
Accuracy (%)
Sensitivity (%)
Specificity (%)
Autoencoder
95.1
97.8
92.5
K-means
58.8
36.8
68.4