

Since the relative energy of most conformers are within a few kcal/mol (ΔE ZPE
values of 76 conformers (84%) are within 3 kcal/mol), the relative abundances of
conformers should depend on a thermal condition as in the case of the core ion.
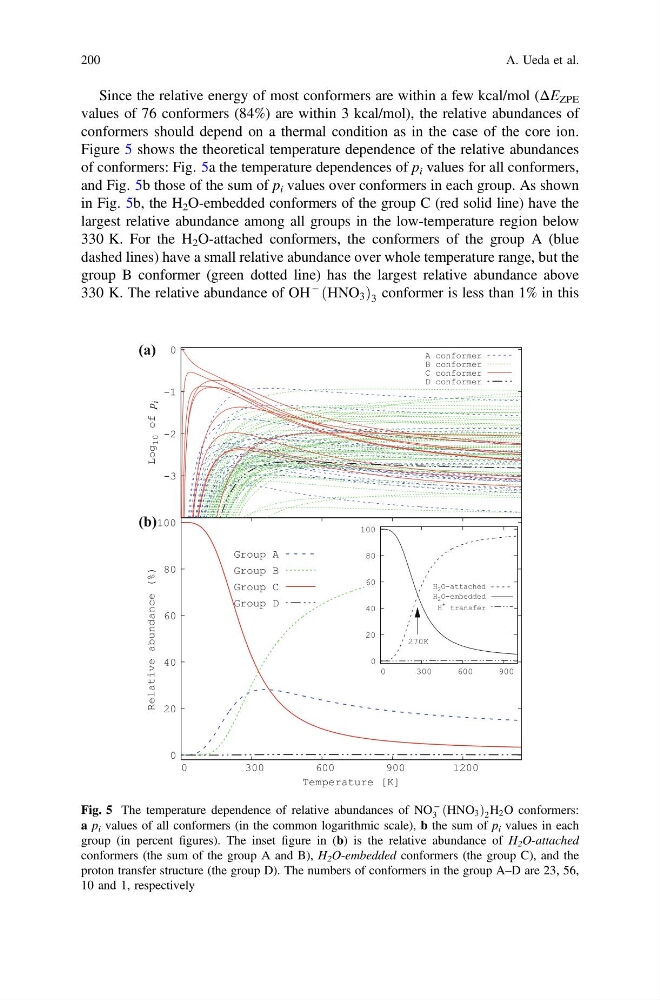
Figure 5 shows the theoretical temperature dependence of the relative abundances
of conformers: Fig. 5a the temperature dependences of p i values for all conformers,
and Fig. 5b those of the sum of p i values over conformers in each group. As shown
in Fig. 5b, the H 2 O-embedded conformers of the group C (red solid line) have the
largest relative abundance among all groups in the low-temperature region below
330 K. For the H 2 O-attached conformers, the conformers of the group A (blue
dashed lines) have a small relative abundance over whole temperature range, but the
group B conformer (green dotted line) has the largest relative abundance above
330 K. The relative abundance of OH
− HNO 3
ð
Þ 3 conformer is less than 1% in this
(a)
(b)
Fig. 5 The temperature dependence of relative abundances of NO
−
3 HNO 3
ð
Þ 2 H 2 O conformers:
a p i values of all conformers (in the common logarithmic scale), b the sum of p i values in each
group (in percent figures). The inset figure in (b) is the relative abundance of H 2 O-attached
conformers (the sum of the group A and B), H 2 O-embedded conformers (the group C), and the
proton transfer structure (the group D). The numbers of conformers in the group A–D are 23, 56,
10 and 1, respectively
200
A. Ueda et al.
values of 76 conformers (84%) are within 3 kcal/mol), the relative abundances of
conformers should depend on a thermal condition as in the case of the core ion.
Figure 5 shows the theoretical temperature dependence of the relative abundances
of conformers: Fig. 5a the temperature dependences of p i values for all conformers,
and Fig. 5b those of the sum of p i values over conformers in each group. As shown
in Fig. 5b, the H 2 O-embedded conformers of the group C (red solid line) have the
largest relative abundance among all groups in the low-temperature region below
330 K. For the H 2 O-attached conformers, the conformers of the group A (blue
dashed lines) have a small relative abundance over whole temperature range, but the
group B conformer (green dotted line) has the largest relative abundance above
330 K. The relative abundance of OH
− HNO 3
ð
Þ 3 conformer is less than 1% in this
(a)
(b)
Fig. 5 The temperature dependence of relative abundances of NO
−
3 HNO 3
ð
Þ 2 H 2 O conformers:
a p i values of all conformers (in the common logarithmic scale), b the sum of p i values in each
group (in percent figures). The inset figure in (b) is the relative abundance of H 2 O-attached
conformers (the sum of the group A and B), H 2 O-embedded conformers (the group C), and the
proton transfer structure (the group D). The numbers of conformers in the group A–D are 23, 56,
10 and 1, respectively
200
A. Ueda et al.