

cytochrome caa 3 , which in B. firmus RAB and B. pseudofirmus OF4 is composed of
three subunits (I–III). In B. pseudofirmus OF4, the cytochrome-caa 3 complex was
coded by the cta operon, with ctaC-F coding for the four subunits [73], while ctaA
and ctaB are involved in heme A synthesis [74, 75]. In B. pseudofirmus OF4, c-type
cytochromes are found to be upregulated at high pHs [41]. Another terminal oxidase
found in B. pseudofirmus is cytochrome-bd, which is only expressed during stationary phase at high pHs and therefore probably does not play a role in alkaliphily
[41]. By comparison, Bacillus YN-2000 expresses cytochrome-aco as its terminal
oxidase, in which heme C and the protoheme O are directly involved in the transfer
of electrons from cytochrome-c553 to oxygen, while heme A might operate as an
electron reservoir [2].
Another defining feature of the surface proteins of alkaliphiles is enrichment of
neutral and acidic residues. For example, the exposed loops of the membrane-bound
cytochrome-caa3 in B. pseudofirmus have a lower number of basic residues than its
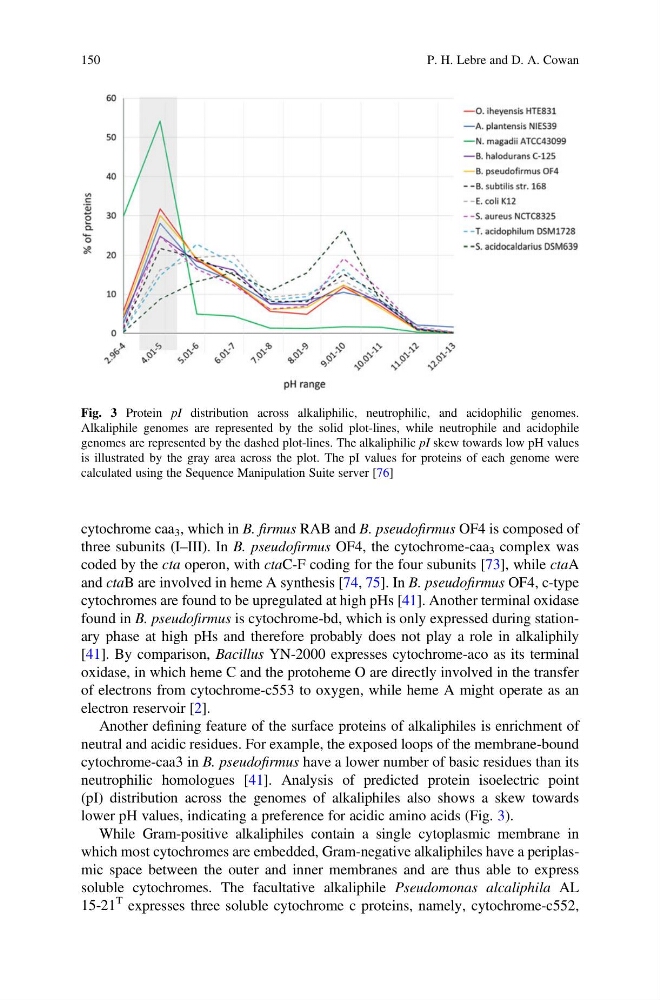
neutrophilic homologues [41]. Analysis of predicted protein isoelectric point
(pI) distribution across the genomes of alkaliphiles also shows a skew towards
lower pH values, indicating a preference for acidic amino acids (Fig. 3).
While Gram-positive alkaliphiles contain a single cytoplasmic membrane in
which most cytochromes are embedded, Gram-negative alkaliphiles have a periplasmic space between the outer and inner membranes and are thus able to express
soluble cytochromes. The facultative alkaliphile Pseudomonas alcaliphila AL
15-21
T expresses three soluble cytochrome c proteins, namely, cytochrome-c552,
Fig. 3 Protein pI distribution across alkaliphilic, neutrophilic, and acidophilic genomes.
Alkaliphile genomes are represented by the solid plot-lines, while neutrophile and acidophile
genomes are represented by the dashed plot-lines. The alkaliphilic pI skew towards low pH values
is illustrated by the gray area across the plot. The pI values for proteins of each genome were
calculated using the Sequence Manipulation Suite server [76]
150
P. H. Lebre and D. A. Cowan
three subunits (I–III). In B. pseudofirmus OF4, the cytochrome-caa 3 complex was
coded by the cta operon, with ctaC-F coding for the four subunits [73], while ctaA
and ctaB are involved in heme A synthesis [74, 75]. In B. pseudofirmus OF4, c-type
cytochromes are found to be upregulated at high pHs [41]. Another terminal oxidase
found in B. pseudofirmus is cytochrome-bd, which is only expressed during stationary phase at high pHs and therefore probably does not play a role in alkaliphily
[41]. By comparison, Bacillus YN-2000 expresses cytochrome-aco as its terminal
oxidase, in which heme C and the protoheme O are directly involved in the transfer
of electrons from cytochrome-c553 to oxygen, while heme A might operate as an
electron reservoir [2].
Another defining feature of the surface proteins of alkaliphiles is enrichment of
neutral and acidic residues. For example, the exposed loops of the membrane-bound
cytochrome-caa3 in B. pseudofirmus have a lower number of basic residues than its
neutrophilic homologues [41]. Analysis of predicted protein isoelectric point
(pI) distribution across the genomes of alkaliphiles also shows a skew towards
lower pH values, indicating a preference for acidic amino acids (Fig. 3).
While Gram-positive alkaliphiles contain a single cytoplasmic membrane in
which most cytochromes are embedded, Gram-negative alkaliphiles have a periplasmic space between the outer and inner membranes and are thus able to express
soluble cytochromes. The facultative alkaliphile Pseudomonas alcaliphila AL
15-21
T expresses three soluble cytochrome c proteins, namely, cytochrome-c552,
Fig. 3 Protein pI distribution across alkaliphilic, neutrophilic, and acidophilic genomes.
Alkaliphile genomes are represented by the solid plot-lines, while neutrophile and acidophile
genomes are represented by the dashed plot-lines. The alkaliphilic pI skew towards low pH values
is illustrated by the gray area across the plot. The pI values for proteins of each genome were
calculated using the Sequence Manipulation Suite server [76]
150
P. H. Lebre and D. A. Cowan