

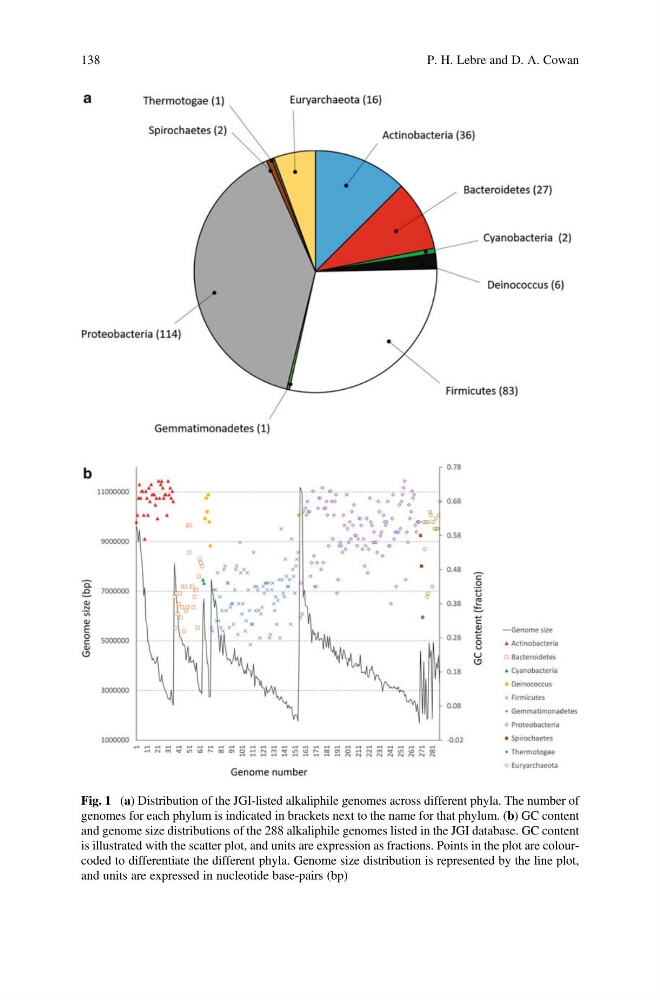
Fig. 1 (a) Distribution of the JGI-listed alkaliphile genomes across different phyla. The number of
genomes for each phylum is indicated in brackets next to the name for that phylum. (b) GC content
and genome size distributions of the 288 alkaliphile genomes listed in the JGI database. GC content
is illustrated with the scatter plot, and units are expression as fractions. Points in the plot are colourcoded to differentiate the different phyla. Genome size distribution is represented by the line plot,
and units are expressed in nucleotide base-pairs (bp)
138
P. H. Lebre and D. A. Cowan
genomes for each phylum is indicated in brackets next to the name for that phylum. (b) GC content
and genome size distributions of the 288 alkaliphile genomes listed in the JGI database. GC content
is illustrated with the scatter plot, and units are expression as fractions. Points in the plot are colourcoded to differentiate the different phyla. Genome size distribution is represented by the line plot,
and units are expressed in nucleotide base-pairs (bp)
138
P. H. Lebre and D. A. Cowan