

Theor Chem Acc (2015) 134:147
1 3
question. In addition to the orbital effect, the additional
charge is delocalized according to the HOMO or LUMO.
3 Results and discussion
3.1 Changes of the geometry due to CT
All three target molecules show actuation effects upon
charging as refl ected by the differences of the optimized
geometries compared to the q = 0 optimized geometry as
a reference. One feature of pancake bond is the overlap of
the two SOMOs to form mc/2e bonds. Figures 7 , 8 , 9 show
that this is also the case in those molecules when optimized
with a modifi cation of the number of electrons. Molecules
1b and 2b show this behavior under reduction, while 3 present an overlap for both oxidation and reduction.
Note that the corresponding HOMO–LUMO gaps are
large (more than 2.0 eV, see Table S3), while they tend to
be small in the case of pancake bonding (Fig. 1 ). Also, the
presence or absence of overlap does not seem to affect the
energy levels signifi cantly. As a result, other metrics are to
be used for these systems.
3.2 Comparison of the different metrics
Table 2 reports the radius and the average deviation from
helicity, using Eq. ( 3 ), for each charge state of the 3 molecules. As mentioned, the overlap goes with a shrinking of
the distances along the Z axis, as reported in Table 3 for the
metric defi ned in the previous section.
From Table 2 , one can see that the CT affects the radius
by a few %. Note that the larger radius difference between
2b and 3 is due to the change from the phenyl units to
naphthalenes, and those two molecules have a larger radius
than 1b , due to the presence of unsaturated carbons in
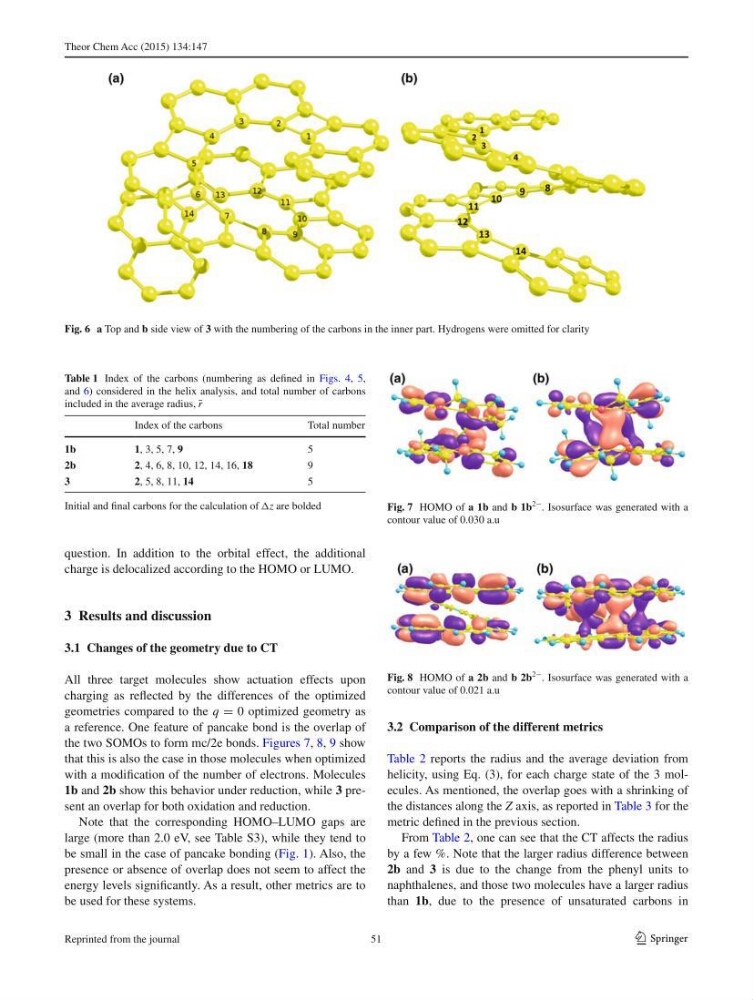
Fig. 6 a Top and b side view of 3 with the numbering of the carbons in the inner part. Hydrogens were omitted for clarity
Table 1 Index of the carbons (numbering as defi ned in Figs. 4 , 5 ,
and 6 ) considered in the helix analysis, and total number of carbons
included in the average radius, ¯
r
Initial and fi nal carbons for the calculation of z are bolded
Index of the carbons
Total number
1b
1 , 3, 5, 7, 9
5
2b
2 , 4, 6, 8, 10, 12, 14, 16, 18
9
3
2 , 5, 8, 11, 14
5
Fig. 7 HOMO of a 1b and b 1b
2−
. Isosurface was generated with a
contour value of 0.030 a.u
Fig. 8 HOMO of a 2b and b 2b
2−
. Isosurface was generated with a
contour value of 0.021 a.u
51
Reprinted from the journal
1 3
question. In addition to the orbital effect, the additional
charge is delocalized according to the HOMO or LUMO.
3 Results and discussion
3.1 Changes of the geometry due to CT
All three target molecules show actuation effects upon
charging as refl ected by the differences of the optimized
geometries compared to the q = 0 optimized geometry as
a reference. One feature of pancake bond is the overlap of
the two SOMOs to form mc/2e bonds. Figures 7 , 8 , 9 show
that this is also the case in those molecules when optimized
with a modifi cation of the number of electrons. Molecules
1b and 2b show this behavior under reduction, while 3 present an overlap for both oxidation and reduction.
Note that the corresponding HOMO–LUMO gaps are
large (more than 2.0 eV, see Table S3), while they tend to
be small in the case of pancake bonding (Fig. 1 ). Also, the
presence or absence of overlap does not seem to affect the
energy levels signifi cantly. As a result, other metrics are to
be used for these systems.
3.2 Comparison of the different metrics
Table 2 reports the radius and the average deviation from
helicity, using Eq. ( 3 ), for each charge state of the 3 molecules. As mentioned, the overlap goes with a shrinking of
the distances along the Z axis, as reported in Table 3 for the
metric defi ned in the previous section.
From Table 2 , one can see that the CT affects the radius
by a few %. Note that the larger radius difference between
2b and 3 is due to the change from the phenyl units to
naphthalenes, and those two molecules have a larger radius
than 1b , due to the presence of unsaturated carbons in
Fig. 6 a Top and b side view of 3 with the numbering of the carbons in the inner part. Hydrogens were omitted for clarity
Table 1 Index of the carbons (numbering as defi ned in Figs. 4 , 5 ,
and 6 ) considered in the helix analysis, and total number of carbons
included in the average radius, ¯
r
Initial and fi nal carbons for the calculation of z are bolded
Index of the carbons
Total number
1b
1 , 3, 5, 7, 9
5
2b
2 , 4, 6, 8, 10, 12, 14, 16, 18
9
3
2 , 5, 8, 11, 14
5
Fig. 7 HOMO of a 1b and b 1b
2−
. Isosurface was generated with a
contour value of 0.030 a.u
Fig. 8 HOMO of a 2b and b 2b
2−
. Isosurface was generated with a
contour value of 0.021 a.u
51
Reprinted from the journal