

THE PETROLEUM CULTURE 149
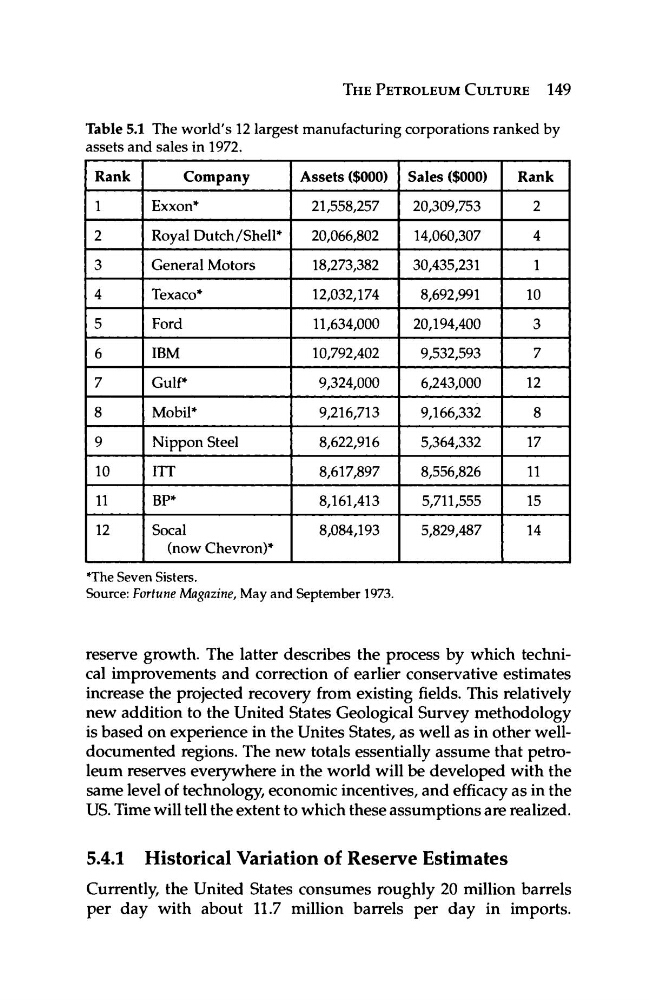
Table 5.1 The world's 12 largest manufacturing corporations ranked by
assets and sales in 1972.
Rank
1
2
3
4
5
6
7
8
9
10
11
12
Company
Exxon*
Royal Dutch /Shell*
General Motors
Texaco*
Ford
IBM
Gulf*
Mobil*
Nippon Steel
ITT
BP*
Socal
(now Chevron)*
Assets ($000)
21,558,257
20,066,802
18,273,382
12,032,174
11,634,000
10,792,402
9,324,000
9,216,713
8,622,916
8,617,897
8,161,413
8,084,193
Sales ($000)
20,309,753
14,060,307
30,435,231
8,692,991
20,194,400
9,532,593
6,243,000
9,166,332
5,364,332
8,556,826
5,711,555
5,829,487
Rank
2
4
1
10
3
7
12
8
17
11
15
14
*The Seven Sisters.
Source: Fortune Magazine, May and September 1973.
reserve growth. The latter describes the process by which technical improvements and correction of earlier conservative estimates
increase the projected recovery from existing fields. This relatively
new addition to the United States Geological Survey methodology
is based on experience in the Unites States, as well as in other welldocumented regions. The new totals essentially assume that petroleum reserves everywhere in the world will be developed with the
same level of technology, economic incentives, and efficacy as in the
US. Time will tell the extent to which these assumptions are realized.
5.4.1 Historical Variation of Reserve Estimates
Currently, the United States consumes roughly 20 million barrels
per day with about 11.7 million barrels per day in imports.
Table 5.1 The world's 12 largest manufacturing corporations ranked by
assets and sales in 1972.
Rank
1
2
3
4
5
6
7
8
9
10
11
12
Company
Exxon*
Royal Dutch /Shell*
General Motors
Texaco*
Ford
IBM
Gulf*
Mobil*
Nippon Steel
ITT
BP*
Socal
(now Chevron)*
Assets ($000)
21,558,257
20,066,802
18,273,382
12,032,174
11,634,000
10,792,402
9,324,000
9,216,713
8,622,916
8,617,897
8,161,413
8,084,193
Sales ($000)
20,309,753
14,060,307
30,435,231
8,692,991
20,194,400
9,532,593
6,243,000
9,166,332
5,364,332
8,556,826
5,711,555
5,829,487
Rank
2
4
1
10
3
7
12
8
17
11
15
14
*The Seven Sisters.
Source: Fortune Magazine, May and September 1973.
reserve growth. The latter describes the process by which technical improvements and correction of earlier conservative estimates
increase the projected recovery from existing fields. This relatively
new addition to the United States Geological Survey methodology
is based on experience in the Unites States, as well as in other welldocumented regions. The new totals essentially assume that petroleum reserves everywhere in the world will be developed with the
same level of technology, economic incentives, and efficacy as in the
US. Time will tell the extent to which these assumptions are realized.
5.4.1 Historical Variation of Reserve Estimates
Currently, the United States consumes roughly 20 million barrels
per day with about 11.7 million barrels per day in imports.