

[115], to finally (iii) the dynamics evolution itself, which has motivated a long
debate between theorists and experimentalists [117–119]. In fact, Levine
et al. [120] have used maps similar to those in Fig. 3 (but computed for stretched
CC distances) to discuss the qualitative deficiencies in the excited-state description
provided by TDDFT.
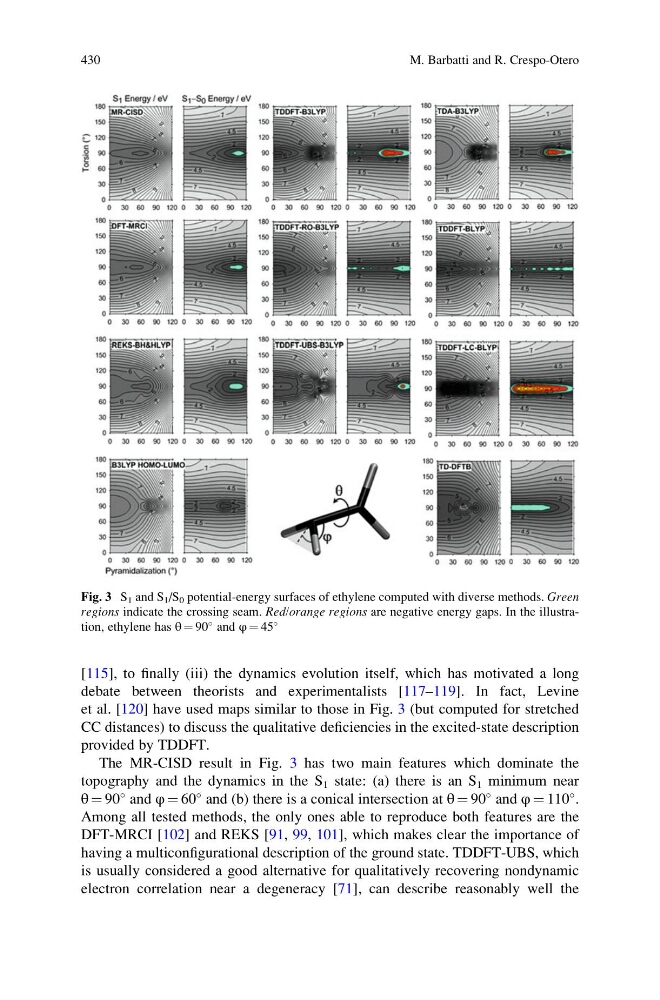
The MR-CISD result in Fig. 3 has two main features which dominate the
topography and the dynamics in the S 1 state: (a) there is an S 1 minimum near
θ ¼ 90
and φ ¼ 60
and (b) there is a conical intersection at θ ¼ 90
and φ ¼ 110
.
Among all tested methods, the only ones able to reproduce both features are the
DFT-MRCI [102] and REKS [91, 99, 101], which makes clear the importance of
having a multiconfigurational description of the ground state. TDDFT-UBS, which
is usually considered a good alternative for qualitatively recovering nondynamic
electron correlation near a degeneracy [71], can describe reasonably well the
Fig. 3 S 1 and S 1 /S 0 potential-energy surfaces of ethylene computed with diverse methods. Green
regions indicate the crossing seam. Red/orange regions are negative energy gaps. In the illustration, ethylene has θ ¼ 90
and φ ¼ 45
430
M. Barbatti and R. Crespo-Otero
debate between theorists and experimentalists [117–119]. In fact, Levine
et al. [120] have used maps similar to those in Fig. 3 (but computed for stretched
CC distances) to discuss the qualitative deficiencies in the excited-state description
provided by TDDFT.
The MR-CISD result in Fig. 3 has two main features which dominate the
topography and the dynamics in the S 1 state: (a) there is an S 1 minimum near
θ ¼ 90
and φ ¼ 60
and (b) there is a conical intersection at θ ¼ 90
and φ ¼ 110
.
Among all tested methods, the only ones able to reproduce both features are the
DFT-MRCI [102] and REKS [91, 99, 101], which makes clear the importance of
having a multiconfigurational description of the ground state. TDDFT-UBS, which
is usually considered a good alternative for qualitatively recovering nondynamic
electron correlation near a degeneracy [71], can describe reasonably well the
Fig. 3 S 1 and S 1 /S 0 potential-energy surfaces of ethylene computed with diverse methods. Green
regions indicate the crossing seam. Red/orange regions are negative energy gaps. In the illustration, ethylene has θ ¼ 90
and φ ¼ 45
430
M. Barbatti and R. Crespo-Otero