

characterized by a series of low-lying MLCT states between 18,480 cm
À1 (S 1 ) and
23,280 cm
À1 (S 9 ). Above 30,000 cm
À1 the ligand-centered LC state’s contributions
become more important with two intense peaks calculated at 33,600 cm
À1 (S 24 ) and
39,520 cm
À1 (S 44 ). These LC states and the peripheral transitions calculated above
33,360 cm
À1 contribute to the two intense experimental UV bands centered at
34,840 and 40,820 cm
À1 . Whereas the maximum observed at 34,840 cm
À1 is well
reproduced by the theoretical “spin-free” spectrum, the maximum at 40,820 cm
À1 is
red shifted by 0.5 eV by the calculation. Moreover, the theoretical maximum at
36,160 cm
À1
, not observed in the experimental spectrum, corresponds to a metalcentered transition corresponding mainly to a d Ir ! 6 s excitation with a diffuse
Rydberg character. Knowing that TD-DFT is not the method of choice for describing the Rydberg excited states [113], this assignment has to be taken with care. The
quality of the upper part of TD-DFT spectrum could certainly be improved by
requesting more roots (actually 200).
The experimental and theoretical maxima of the first band observed between
20,000 and 25,000 cm
À1 do not coincide exactly, the theoretical band being slightly
shifted to the red. However, several MLCT states with rather large oscillator
strengths are calculated in this region (Table 1). The accuracy of the calculations
performed in vacuum does not allow further comparison. The data reported in
Table 1 illustrate the high density of singlet and triplet excited states within
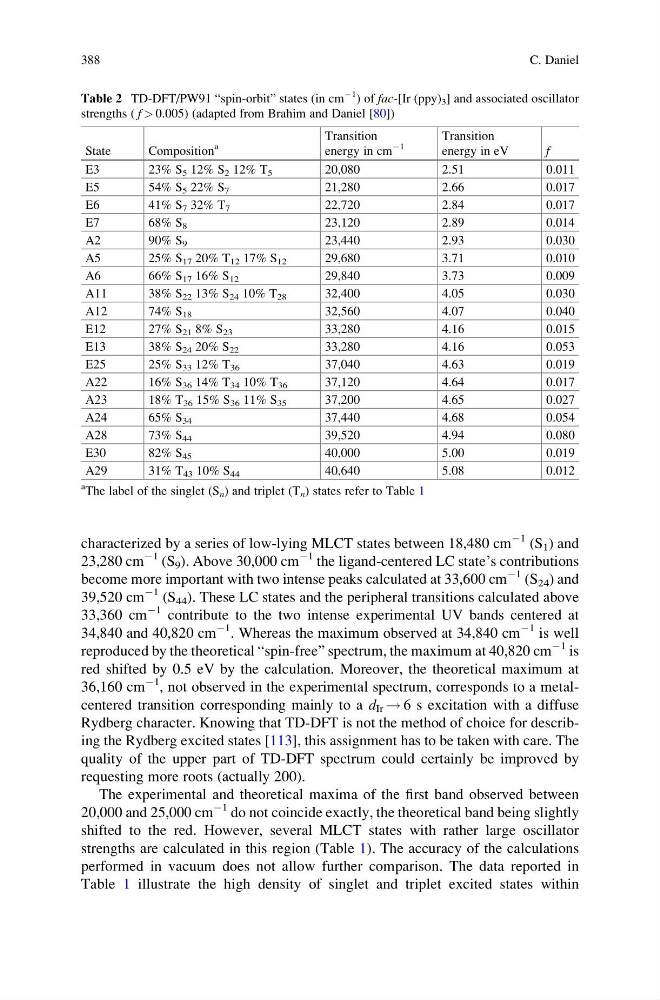
Table 2 TD-DFT/PW91 “spin-orbit” states (in cm
À1
) of fac-[Ir (ppy) 3 ] and associated oscillator
strengths ( f > 0.005) (adapted from Brahim and Daniel [80])
State
Composition
a
Transition
energy in cm
À1
Transition
energy in eV
f
E3
23% S 5 12% S 2 12% T 5
20,080
2.51
0.011
E5
54% S 5 22% S 7
21,280
2.66
0.017
E6
41% S 7 32% T 7
22,720
2.84
0.017
E7
68% S 8
23,120
2.89
0.014
A2
90% S 9
23,440
2.93
0.030
A5
25% S 17 20% T 12 17% S 12
29,680
3.71
0.010
A6
66% S 17 16% S 12
29,840
3.73
0.009
A11
38% S 22 13% S 24 10% T 28
32,400
4.05
0.030
A12
74% S 18
32,560
4.07
0.040
E12
27% S 21 8% S 23
33,280
4.16
0.015
E13
38% S 24 20% S 22
33,280
4.16
0.053
E25
25% S 33 12% T 36
37,040
4.63
0.019
A22
16% S 36 14% T 34 10% T 36
37,120
4.64
0.017
A23
18% T 36 15% S 36 11% S 35
37,200
4.65
0.027
A24
65% S 34
37,440
4.68
0.054
A28
73% S 44
39,520
4.94
0.080
E30
82% S 45
40,000
5.00
0.019
A29
31% T 43 10% S 44
40,640
5.08
0.012
a
The label of the singlet (S n ) and triplet (T n ) states refer to Table 1
388
C. Daniel
À1 (S 1 ) and
23,280 cm
À1 (S 9 ). Above 30,000 cm
À1 the ligand-centered LC state’s contributions
become more important with two intense peaks calculated at 33,600 cm
À1 (S 24 ) and
39,520 cm
À1 (S 44 ). These LC states and the peripheral transitions calculated above
33,360 cm
À1 contribute to the two intense experimental UV bands centered at
34,840 and 40,820 cm
À1 . Whereas the maximum observed at 34,840 cm
À1 is well
reproduced by the theoretical “spin-free” spectrum, the maximum at 40,820 cm
À1 is
red shifted by 0.5 eV by the calculation. Moreover, the theoretical maximum at
36,160 cm
À1
, not observed in the experimental spectrum, corresponds to a metalcentered transition corresponding mainly to a d Ir ! 6 s excitation with a diffuse
Rydberg character. Knowing that TD-DFT is not the method of choice for describing the Rydberg excited states [113], this assignment has to be taken with care. The
quality of the upper part of TD-DFT spectrum could certainly be improved by
requesting more roots (actually 200).
The experimental and theoretical maxima of the first band observed between
20,000 and 25,000 cm
À1 do not coincide exactly, the theoretical band being slightly
shifted to the red. However, several MLCT states with rather large oscillator
strengths are calculated in this region (Table 1). The accuracy of the calculations
performed in vacuum does not allow further comparison. The data reported in
Table 1 illustrate the high density of singlet and triplet excited states within
Table 2 TD-DFT/PW91 “spin-orbit” states (in cm
À1
) of fac-[Ir (ppy) 3 ] and associated oscillator
strengths ( f > 0.005) (adapted from Brahim and Daniel [80])
State
Composition
a
Transition
energy in cm
À1
Transition
energy in eV
f
E3
23% S 5 12% S 2 12% T 5
20,080
2.51
0.011
E5
54% S 5 22% S 7
21,280
2.66
0.017
E6
41% S 7 32% T 7
22,720
2.84
0.017
E7
68% S 8
23,120
2.89
0.014
A2
90% S 9
23,440
2.93
0.030
A5
25% S 17 20% T 12 17% S 12
29,680
3.71
0.010
A6
66% S 17 16% S 12
29,840
3.73
0.009
A11
38% S 22 13% S 24 10% T 28
32,400
4.05
0.030
A12
74% S 18
32,560
4.07
0.040
E12
27% S 21 8% S 23
33,280
4.16
0.015
E13
38% S 24 20% S 22
33,280
4.16
0.053
E25
25% S 33 12% T 36
37,040
4.63
0.019
A22
16% S 36 14% T 34 10% T 36
37,120
4.64
0.017
A23
18% T 36 15% S 36 11% S 35
37,200
4.65
0.027
A24
65% S 34
37,440
4.68
0.054
A28
73% S 44
39,520
4.94
0.080
E30
82% S 45
40,000
5.00
0.019
A29
31% T 43 10% S 44
40,640
5.08
0.012
a
The label of the singlet (S n ) and triplet (T n ) states refer to Table 1
388
C. Daniel