

found to be non-negligible, e.g., it is À0.08 eV on average for the set of molecules
shown in Fig. 2 [15]. Similar values have been obtained with other sets of molecules
[13, 66].
With coworkers, we have investigated the E
AFCP of the compounds displayed in
Fig. 2 using (10) and 12 XCF [15, 70, 71]. More precisely, we have used the
LR-PCM model combined to the 6-31+G(d) atomic basis set for the geometrical
and (harmonic) vibrational parameters whereas the electronic energies were computed at the cLR-PCM level with the 6-311++G(2df,2p) atomic basis set. The
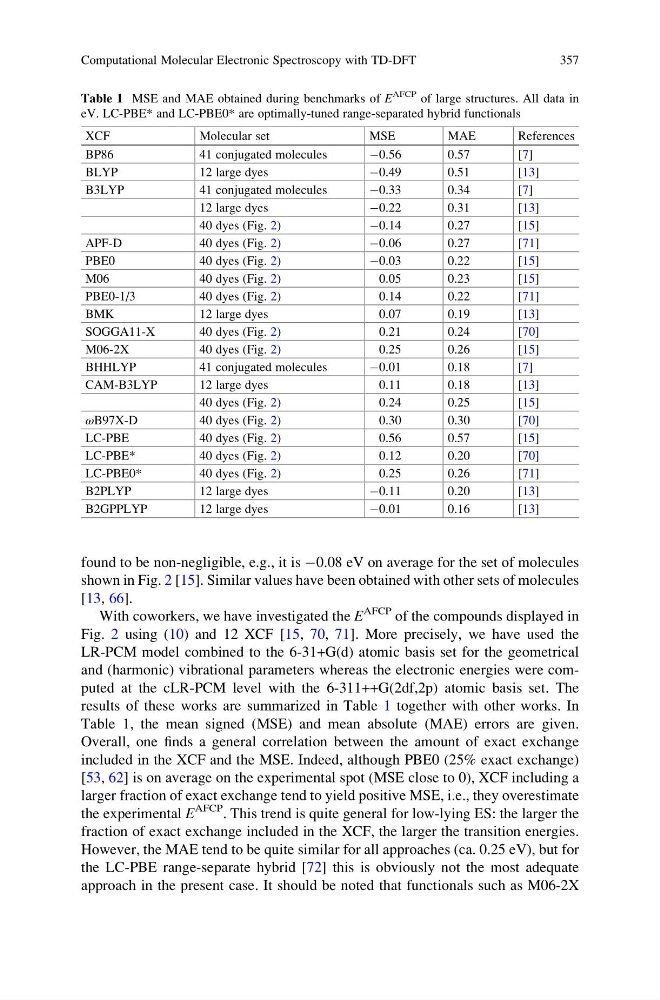
results of these works are summarized in Table 1 together with other works. In
Table 1, the mean signed (MSE) and mean absolute (MAE) errors are given.
Overall, one finds a general correlation between the amount of exact exchange
included in the XCF and the MSE. Indeed, although PBE0 (25% exact exchange)
[53, 62] is on average on the experimental spot (MSE close to 0), XCF including a
larger fraction of exact exchange tend to yield positive MSE, i.e., they overestimate
the experimental E
AFCP . This trend is quite general for low-lying ES: the larger the
fraction of exact exchange included in the XCF, the larger the transition energies.
However, the MAE tend to be quite similar for all approaches (ca. 0.25 eV), but for
the LC-PBE range-separate hybrid [72] this is obviously not the most adequate
approach in the present case. It should be noted that functionals such as M06-2X
Table 1 MSE and MAE obtained during benchmarks of E
AFCP of large structures. All data in
eV. LC-PBE* and LC-PBE0* are optimally-tuned range-separated hybrid functionals
XCF
Molecular set
MSE
MAE
References
BP86
41 conjugated molecules
À0.56
0.57
[7]
BLYP
12 large dyes
À0.49
0.51
[13]
B3LYP
41 conjugated molecules
À0.33
0.34
[7]
12 large dyes
À0.22
0.31
[13]
40 dyes (Fig. 2)
À0.14
0.27
[15]
APF-D
40 dyes (Fig. 2)
À0.06
0.27
[71]
PBE0
40 dyes (Fig. 2)
À0.03
0.22
[15]
M06
40 dyes (Fig. 2)
0.05
0.23
[15]
PBE0-1/3
40 dyes (Fig. 2)
0.14
0.22
[71]
BMK
12 large dyes
0.07
0.19
[13]
SOGGA11-X
40 dyes (Fig. 2)
0.21
0.24
[70]
M06-2X
40 dyes (Fig. 2)
0.25
0.26
[15]
BHHLYP
41 conjugated molecules
À0.01
0.18
[7]
CAM-B3LYP
12 large dyes
0.11
0.18
[13]
40 dyes (Fig. 2)
0.24
0.25
[15]
ωB97X-D
40 dyes (Fig. 2)
0.30
0.30
[70]
LC-PBE
40 dyes (Fig. 2)
0.56
0.57
[15]
LC-PBE*
40 dyes (Fig. 2)
0.12
0.20
[70]
LC-PBE0*
40 dyes (Fig. 2)
0.25
0.26
[71]
B2PLYP
12 large dyes
À0.11
0.20
[13]
B2GPPLYP
12 large dyes
À0.01
0.16
[13]
Computational Molecular Electronic Spectroscopy with TD-DFT
357
shown in Fig. 2 [15]. Similar values have been obtained with other sets of molecules
[13, 66].
With coworkers, we have investigated the E
AFCP of the compounds displayed in
Fig. 2 using (10) and 12 XCF [15, 70, 71]. More precisely, we have used the
LR-PCM model combined to the 6-31+G(d) atomic basis set for the geometrical
and (harmonic) vibrational parameters whereas the electronic energies were computed at the cLR-PCM level with the 6-311++G(2df,2p) atomic basis set. The
results of these works are summarized in Table 1 together with other works. In
Table 1, the mean signed (MSE) and mean absolute (MAE) errors are given.
Overall, one finds a general correlation between the amount of exact exchange
included in the XCF and the MSE. Indeed, although PBE0 (25% exact exchange)
[53, 62] is on average on the experimental spot (MSE close to 0), XCF including a
larger fraction of exact exchange tend to yield positive MSE, i.e., they overestimate
the experimental E
AFCP . This trend is quite general for low-lying ES: the larger the
fraction of exact exchange included in the XCF, the larger the transition energies.
However, the MAE tend to be quite similar for all approaches (ca. 0.25 eV), but for
the LC-PBE range-separate hybrid [72] this is obviously not the most adequate
approach in the present case. It should be noted that functionals such as M06-2X
Table 1 MSE and MAE obtained during benchmarks of E
AFCP of large structures. All data in
eV. LC-PBE* and LC-PBE0* are optimally-tuned range-separated hybrid functionals
XCF
Molecular set
MSE
MAE
References
BP86
41 conjugated molecules
À0.56
0.57
[7]
BLYP
12 large dyes
À0.49
0.51
[13]
B3LYP
41 conjugated molecules
À0.33
0.34
[7]
12 large dyes
À0.22
0.31
[13]
40 dyes (Fig. 2)
À0.14
0.27
[15]
APF-D
40 dyes (Fig. 2)
À0.06
0.27
[71]
PBE0
40 dyes (Fig. 2)
À0.03
0.22
[15]
M06
40 dyes (Fig. 2)
0.05
0.23
[15]
PBE0-1/3
40 dyes (Fig. 2)
0.14
0.22
[71]
BMK
12 large dyes
0.07
0.19
[13]
SOGGA11-X
40 dyes (Fig. 2)
0.21
0.24
[70]
M06-2X
40 dyes (Fig. 2)
0.25
0.26
[15]
BHHLYP
41 conjugated molecules
À0.01
0.18
[7]
CAM-B3LYP
12 large dyes
0.11
0.18
[13]
40 dyes (Fig. 2)
0.24
0.25
[15]
ωB97X-D
40 dyes (Fig. 2)
0.30
0.30
[70]
LC-PBE
40 dyes (Fig. 2)
0.56
0.57
[15]
LC-PBE*
40 dyes (Fig. 2)
0.12
0.20
[70]
LC-PBE0*
40 dyes (Fig. 2)
0.25
0.26
[71]
B2PLYP
12 large dyes
À0.11
0.20
[13]
B2GPPLYP
12 large dyes
À0.01
0.16
[13]
Computational Molecular Electronic Spectroscopy with TD-DFT
357