

correlated systems [328]. XDQC signals exist only when single core excitations
interact with each other and doubly core-excited states are not simply an outer
product of two singly core-excited states. XDQC signals vanish for noninteracting
single core excitations.
We have simulated the XDQC signals of formamide at the N and O K-edges
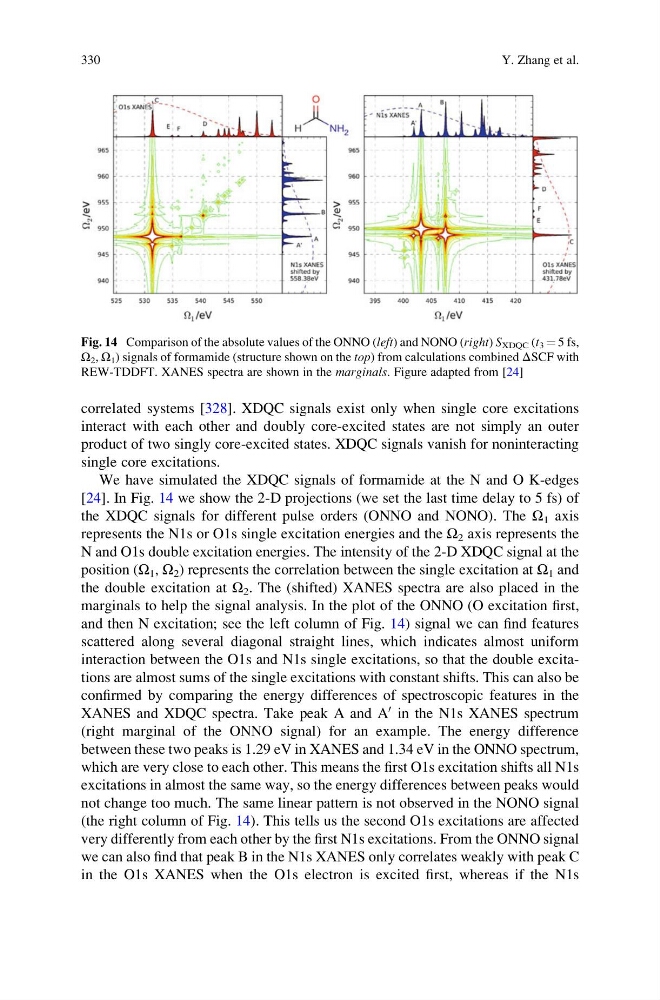
[24]. In Fig. 14 we show the 2-D projections (we set the last time delay to 5 fs) of
the XDQC signals for different pulse orders (ONNO and NONO). The Ω 1 axis
represents the N1s or O1s single excitation energies and the Ω 2 axis represents the
N and O1s double excitation energies. The intensity of the 2-D XDQC signal at the
position (Ω 1 , Ω 2 ) represents the correlation between the single excitation at Ω 1 and
the double excitation at Ω 2 . The (shifted) XANES spectra are also placed in the
marginals to help the signal analysis. In the plot of the ONNO (O excitation first,
and then N excitation; see the left column of Fig. 14) signal we can find features
scattered along several diagonal straight lines, which indicates almost uniform
interaction between the O1s and N1s single excitations, so that the double excitations are almost sums of the single excitations with constant shifts. This can also be
confirmed by comparing the energy differences of spectroscopic features in the
XANES and XDQC spectra. Take peak A and A
0 in the N1s XANES spectrum
(right marginal of the ONNO signal) for an example. The energy difference
between these two peaks is 1.29 eV in XANES and 1.34 eV in the ONNO spectrum,
which are very close to each other. This means the first O1s excitation shifts all N1s
excitations in almost the same way, so the energy differences between peaks would
not change too much. The same linear pattern is not observed in the NONO signal
(the right column of Fig. 14). This tells us the second O1s excitations are affected
very differently from each other by the first N1s excitations. From the ONNO signal
we can also find that peak B in the N1s XANES only correlates weakly with peak C
in the O1s XANES when the O1s electron is excited first, whereas if the N1s
Fig. 14 Comparison of the absolute values of the ONNO (left) and NONO (right) S XDQC (t 3 ¼ 5 fs,
Ω 2 , Ω 1 ) signals of formamide (structure shown on the top) from calculations combined ΔSCF with
REW-TDDFT. XANES spectra are shown in the marginals. Figure adapted from [24]
330
Y. Zhang et al.
interact with each other and doubly core-excited states are not simply an outer
product of two singly core-excited states. XDQC signals vanish for noninteracting
single core excitations.
We have simulated the XDQC signals of formamide at the N and O K-edges
[24]. In Fig. 14 we show the 2-D projections (we set the last time delay to 5 fs) of
the XDQC signals for different pulse orders (ONNO and NONO). The Ω 1 axis
represents the N1s or O1s single excitation energies and the Ω 2 axis represents the
N and O1s double excitation energies. The intensity of the 2-D XDQC signal at the
position (Ω 1 , Ω 2 ) represents the correlation between the single excitation at Ω 1 and
the double excitation at Ω 2 . The (shifted) XANES spectra are also placed in the
marginals to help the signal analysis. In the plot of the ONNO (O excitation first,
and then N excitation; see the left column of Fig. 14) signal we can find features
scattered along several diagonal straight lines, which indicates almost uniform
interaction between the O1s and N1s single excitations, so that the double excitations are almost sums of the single excitations with constant shifts. This can also be
confirmed by comparing the energy differences of spectroscopic features in the
XANES and XDQC spectra. Take peak A and A
0 in the N1s XANES spectrum
(right marginal of the ONNO signal) for an example. The energy difference
between these two peaks is 1.29 eV in XANES and 1.34 eV in the ONNO spectrum,
which are very close to each other. This means the first O1s excitation shifts all N1s
excitations in almost the same way, so the energy differences between peaks would
not change too much. The same linear pattern is not observed in the NONO signal
(the right column of Fig. 14). This tells us the second O1s excitations are affected
very differently from each other by the first N1s excitations. From the ONNO signal
we can also find that peak B in the N1s XANES only correlates weakly with peak C
in the O1s XANES when the O1s electron is excited first, whereas if the N1s
Fig. 14 Comparison of the absolute values of the ONNO (left) and NONO (right) S XDQC (t 3 ¼ 5 fs,
Ω 2 , Ω 1 ) signals of formamide (structure shown on the top) from calculations combined ΔSCF with
REW-TDDFT. XANES spectra are shown in the marginals. Figure adapted from [24]
330
Y. Zhang et al.