

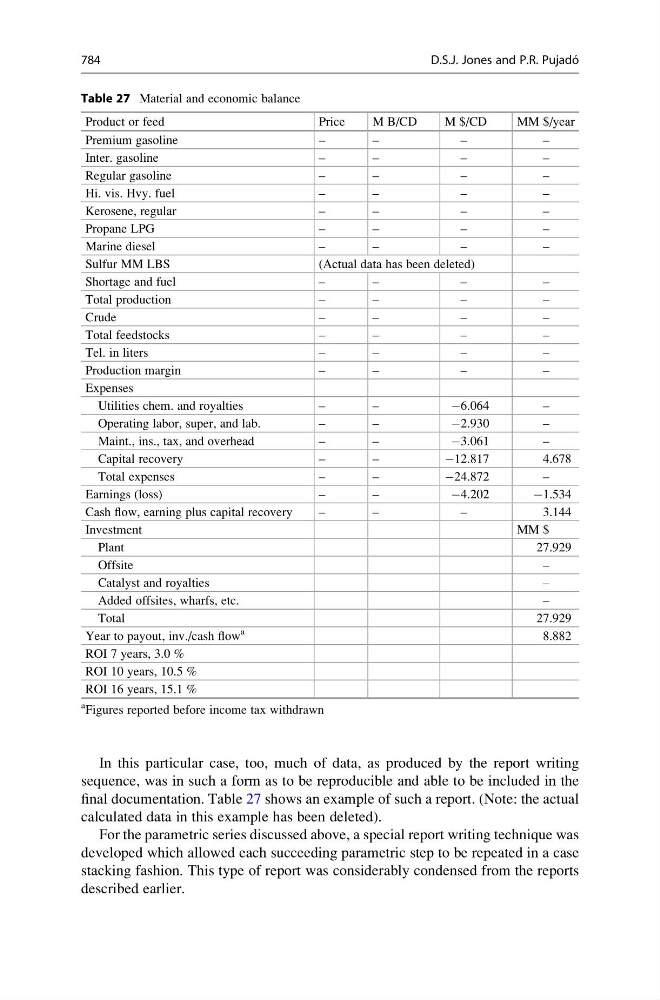
In this particular case, too, much of data, as produced by the report writing
sequence, was in such a form as to be reproducible and able to be included in the
final documentation. Table 27 shows an example of such a report. (Note: the actual
calculated data in this example has been deleted).
For the parametric series discussed above, a special report writing technique was
developed which allowed each succeeding parametric step to be repeated in a case
stacking fashion. This type of report was considerably condensed from the reports
described earlier.
Table 27 Material and economic balance
Product or feed
Price
M B/CD
M $/CD
MM $/year
Premium gasoline
–
–
–
–
Inter. gasoline
–
–
–
–
Regular gasoline
–
–
–
–
Hi. vis. Hvy. fuel
–
–
–
–
Kerosene, regular
–
–
–
–
Propane LPG
–
–
–
–
Marine diesel
–
–
–
–
Sulfur MM LBS
(Actual data has been deleted)
Shortage and fuel
–
–
–
–
Total production
–
–
–
–
Crude
–
–
–
–
Total feedstocks
–
–
–
–
Tel. in liters
–
–
–
–
Production margin
–
–
–
–
Expenses
Utilities chem. and royalties
–
–
À6.064
–
Operating labor, super, and lab.
–
–
À2.930
–
Maint., ins., tax, and overhead
–
–
À3.061
–
Capital recovery
–
–
À12.817
4.678
Total expenses
–
–
À24.872
–
Earnings (loss)
–
–
À4.202
À1.534
Cash flow, earning plus capital recovery
–
–
–
3.144
Investment
MM $
Plant
27.929
Offsite
–
Catalyst and royalties
–
Added offsites, wharfs, etc.
–
Total
27.929
Year to payout, inv./cash flow
a
8.882
ROI 7 years, 3.0 %
ROI 10 years, 10.5 %
ROI 16 years, 15.1 %
a
Figures reported before income tax withdrawn
784
D.S.J. Jones and P.R. Pujado ´