

overlooked. Some of these reports used in this study were called the BI/DJ and
range output. They warrant a brief explanation.
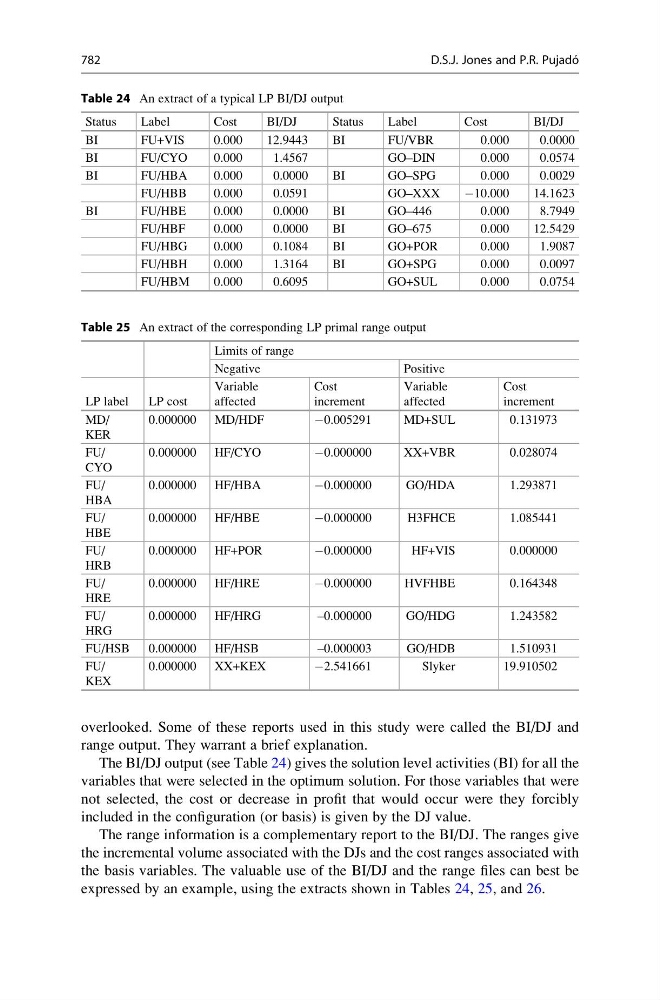
The BI/DJ output (see Table 24) gives the solution level activities (BI) for all the
variables that were selected in the optimum solution. For those variables that were
not selected, the cost or decrease in profit that would occur were they forcibly
included in the configuration (or basis) is given by the DJ value.
The range information is a complementary report to the BI/DJ. The ranges give
the incremental volume associated with the DJs and the cost ranges associated with
the basis variables. The valuable use of the BI/DJ and the range files can best be
expressed by an example, using the extracts shown in Tables 24, 25, and 26.
Table 24 An extract of a typical LP BI/DJ output
Status
Label
Cost
BI/DJ
Status
Label
Cost
BI/DJ
BI
FU+VIS
0.000
12.9443
BI
FU/VBR
0.000
0.0000
BI
FU/CYO
0.000
1.4567
GO–DIN
0.000
0.0574
BI
FU/HBA
0.000
0.0000
BI
GO–SPG
0.000
0.0029
FU/HBB
0.000
0.0591
GO–XXX
À10.000
14.1623
BI
FU/HBE
0.000
0.0000
BI
GO–446
0.000
8.7949
FU/HBF
0.000
0.0000
BI
GO–675
0.000
12.5429
FU/HBG
0.000
0.1084
BI
GO+POR
0.000
1.9087
FU/HBH
0.000
1.3164
BI
GO+SPG
0.000
0.0097
FU/HBM
0.000
0.6095
GO+SUL
0.000
0.0754
Table 25 An extract of the corresponding LP primal range output
Limits of range
Negative
Positive
LP label
LP cost
Variable
affected
Cost
increment
Variable
affected
Cost
increment
MD/
KER
0.000000 MD/HDF
À0.005291
MD+SUL
0.131973
FU/
CYO
0.000000 HF/CYO
À0.000000
XX+VBR
0.028074
FU/
HBA
0.000000 HF/HBA
À0.000000
GO/HDA
1.293871
FU/
HBE
0.000000 HF/HBE
À0.000000
H3FHCE
1.085441
FU/
HRB
0.000000 HF+POR
À0.000000
HF+VIS
0.000000
FU/
HRE
0.000000 HF/HRE
À0.000000
HVFHBE
0.164348
FU/
HRG
0.000000 HF/HRG
–0.000000
GO/HDG
1.243582
FU/HSB 0.000000 HF/HSB
–0.000003
GO/HDB
1.510931
FU/
KEX
0.000000 XX+KEX
À2.541661
Slyker
19.910502
782
D.S.J. Jones and P.R. Pujado ´