

Discounted Cash Flow and Economic Analysis
Throughout this chapter, a major role of a process engineer in conducting economic
studies has been described and discussed. The purpose of these studies is to provide
the company’s management with sound technical data to enable them to improve
the company’s profitability at minimum financial risk to the company. Up to now,
the course of these studies has covered:
• Identifying the viable options that will meet the study objectives
• Short-listing and screening the options using simple return on investment
techniques
• Providing process input into the preparation of a more detailed capital cost
estimate of those options selected for further detailed economic evaluation
The cost estimates based on firm equipment costs are the most accurate possible
without committing to more detail design and capital expenditure. Using these
estimates, the detailed and more reliable prediction of the profitability of the
selected options can now proceed. This prediction is based on a return on investment calculated from a projected cash flow of the process over a prescribed
economic life for the facility.
There are several methods of assessing profitability based on discounted cash
flow (DCF), but one such method is a return on investment method using the present
worth (or net present value) concept. This concept equates the present value of a
future cash flow as a product of the present interest value factor and the future cash
flow. Based on this concept, the return on investment is that interest value or
discount factor which forces the cumulative present worth value to zero over the
economic life of the project. Other methods are described and discussed in section
“Using Linear Programming to Optimize Process Configurations,” which follows.
Whereas the development of capital cost of plants is usually a combined effort
between the development engineer and cost estimator, so is the development of a
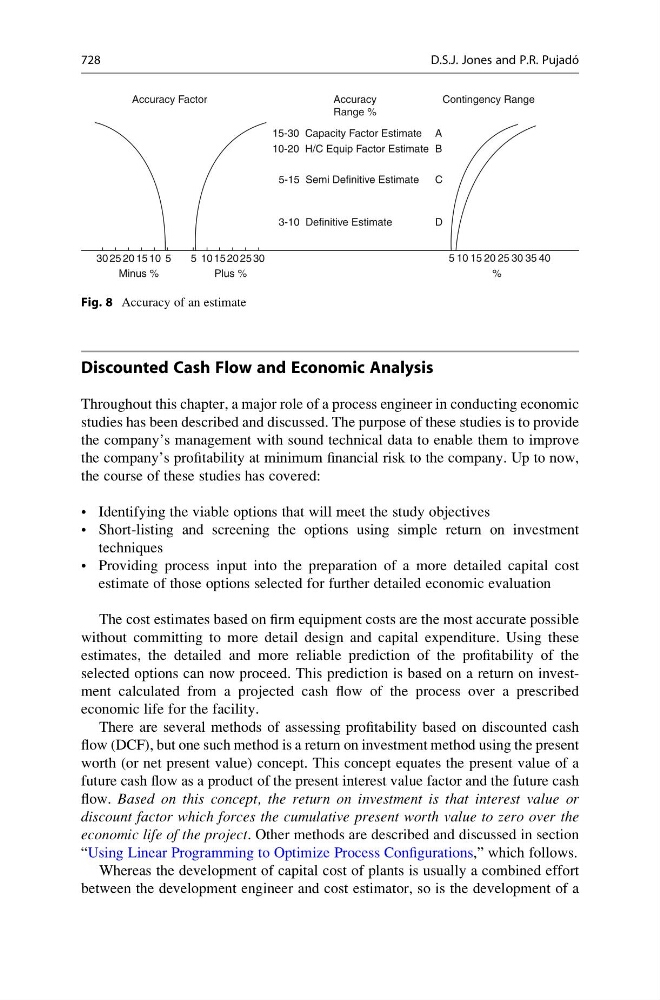
Accuracy Factor
15-30 Capacity Factor Estimate
10-20 H/C Equip Factor Estimate
5-15 Semi Definitive Estimate
3-10 Definitive Estimate
30
30
25
25
20
20
15
15
10
Minus %
Plus %
10
5
5
30 35 40
25
20
15
%
10
5
A
Contingency Range
B
C
D
Accuracy
Range %
Fig. 8 Accuracy of an estimate
728
D.S.J. Jones and P.R. Pujado ´