

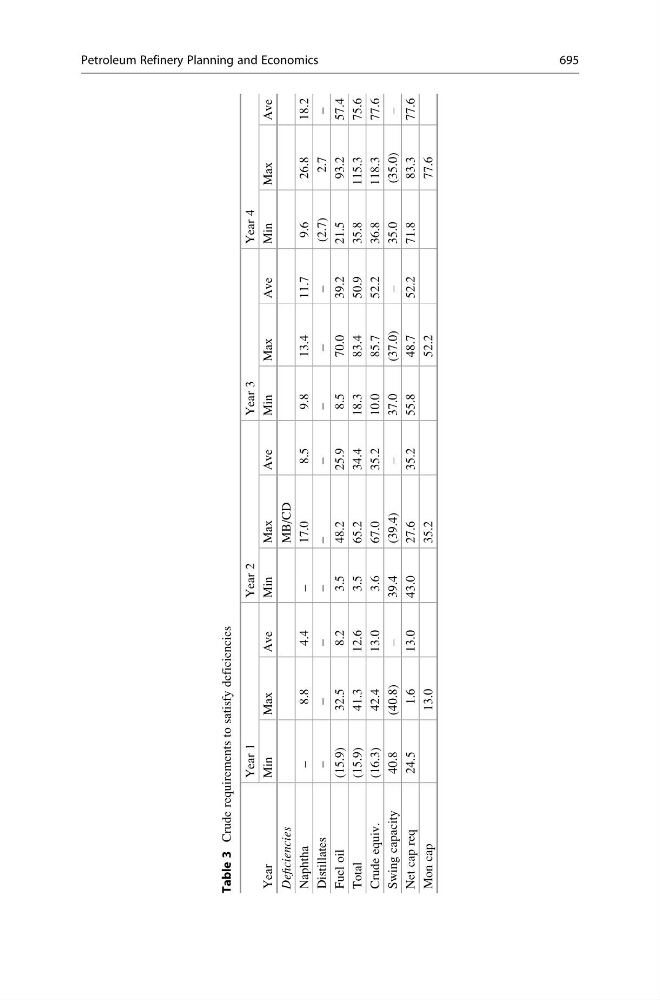
Table 3
Crude requirements to satisfy deficiencies
Year
Year 1
Year 2
Year 3
Year 4
Min
Max
Ave
Min
Max
Ave
Min
Max
Ave
Min
Max
Ave
Deficiencies
MB/CD
Naphtha
–
8.8
4.4
–
17.0
8.5
9.8
13.4
11.7
9.6
26.8
18.2
Distillates
–
–
–
–
–
–
–
–
–
(2.7)
2.7
–
Fuel oil
(15.9)
32.5
8.2
3.5
48.2
25.9
8.5
70.0
39.2
21.5
93.2
57.4
Total
(15.9)
41.3
12.6
3.5
65.2
34.4
18.3
83.4
50.9
35.8
115.3
75.6
Crude equiv.
(16.3)
42.4
13.0
3.6
67.0
35.2
10.0
85.7
52.2
36.8
118.3
77.6
Swing capacity
40.8
(40.8)
–
39.4
(39.4)
–
37.0
(37.0)
–
35.0
(35.0)
–
Net cap req
24.5
1.6
13.0
43.0
27.6
35.2
55.8
48.7
52.2
71.8
83.3
77.6
Mon cap
13.0
35.2
52.2
77.6
Petroleum Refinery Planning and Economics
695