

temperature profile with a 75 % efficiency for rectifying trays and a 65 % efficiency
for the stripping trays (see Fig. 4). Both the temperature profile and the tray
efficiencies will be finalized by a suitable computer simulation package or a
rigorous tray-to-tray calculation. Note: The calculation techniques and examples
given here are good input to computer simulation packages; wherever possible,
these packages should be used for final process design.
Tower Loading and Sizing
Light ends towers all follow the following principles of cross-sectional area sizing
and tower height. These dimensions are interrelated by the height required between
trays to ensure proper separation of clear liquid from the frothy mixture of the tray
inlet fluid. There are many procedures and correlations to determine these dimensions. The following method is just one which will provide a good estimate for
tower design. For definitive design, however it is essential that tray manufacturers
be consulted and their methodology be used. After all they, the manufacturers, will
be required to guarantee the performance of the unit in terms of flooding capacity
and tray efficiency. In all cases this has to be a significant consideration, but in case
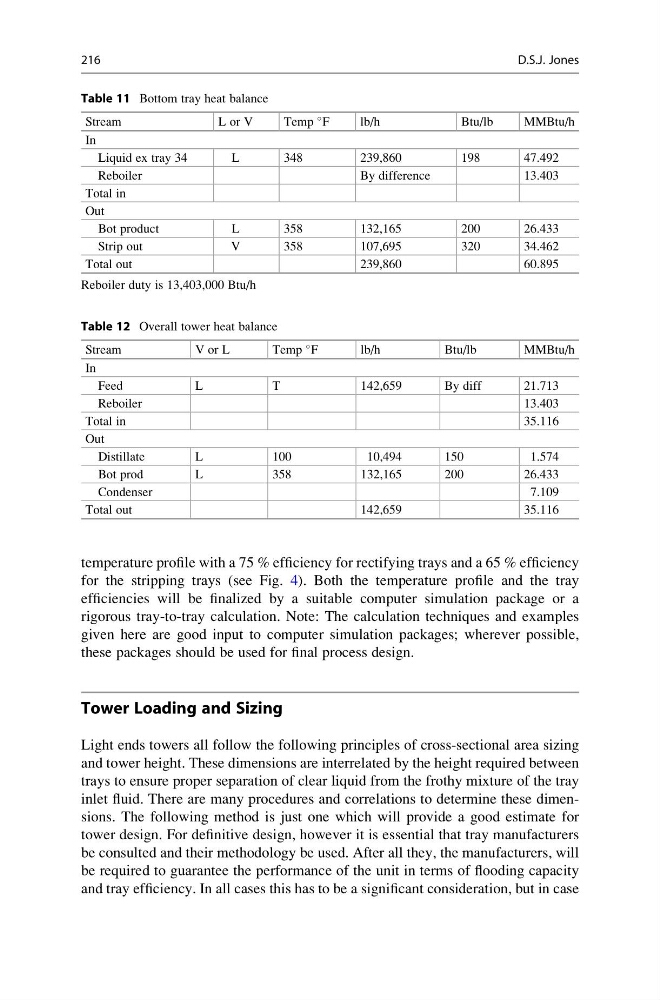
Table 12 Overall tower heat balance
Stream
V or L
Temp
F
lb/h
Btu/lb
MMBtu/h
In
Feed
L
T
142,659
By diff
21.713
Reboiler
13.403
Total in
35.116
Out
Distillate
L
100
10,494
150
1.574
Bot prod
L
358
132,165
200
26.433
Condenser
7.109
Total out
142,659
35.116
Table 11 Bottom tray heat balance
Stream
L or V
Temp
F
lb/h
Btu/lb
MMBtu/h
In
Liquid ex tray 34
L
348
239,860
198
47.492
Reboiler
By difference
13.403
Total in
Out
Bot product
L
358
132,165
200
26.433
Strip out
V
358
107,695
320
34.462
Total out
239,860
60.895
Reboiler duty is 13,403,000 Btu/h
216
D.S.J. Jones
for the stripping trays (see Fig. 4). Both the temperature profile and the tray
efficiencies will be finalized by a suitable computer simulation package or a
rigorous tray-to-tray calculation. Note: The calculation techniques and examples
given here are good input to computer simulation packages; wherever possible,
these packages should be used for final process design.
Tower Loading and Sizing
Light ends towers all follow the following principles of cross-sectional area sizing
and tower height. These dimensions are interrelated by the height required between
trays to ensure proper separation of clear liquid from the frothy mixture of the tray
inlet fluid. There are many procedures and correlations to determine these dimensions. The following method is just one which will provide a good estimate for
tower design. For definitive design, however it is essential that tray manufacturers
be consulted and their methodology be used. After all they, the manufacturers, will
be required to guarantee the performance of the unit in terms of flooding capacity
and tray efficiency. In all cases this has to be a significant consideration, but in case
Table 12 Overall tower heat balance
Stream
V or L
Temp
F
lb/h
Btu/lb
MMBtu/h
In
Feed
L
T
142,659
By diff
21.713
Reboiler
13.403
Total in
35.116
Out
Distillate
L
100
10,494
150
1.574
Bot prod
L
358
132,165
200
26.433
Condenser
7.109
Total out
142,659
35.116
Table 11 Bottom tray heat balance
Stream
L or V
Temp
F
lb/h
Btu/lb
MMBtu/h
In
Liquid ex tray 34
L
348
239,860
198
47.492
Reboiler
By difference
13.403
Total in
Out
Bot product
L
358
132,165
200
26.433
Strip out
V
358
107,695
320
34.462
Total out
239,860
60.895
Reboiler duty is 13,403,000 Btu/h
216
D.S.J. Jones