

ΔT 50 % DRL À FRL
ð
Þ¼40
F
T 50 % DRL ¼ 667
F
Then T 50 % FRL ¼ 667 À 40 ¼ 627
F
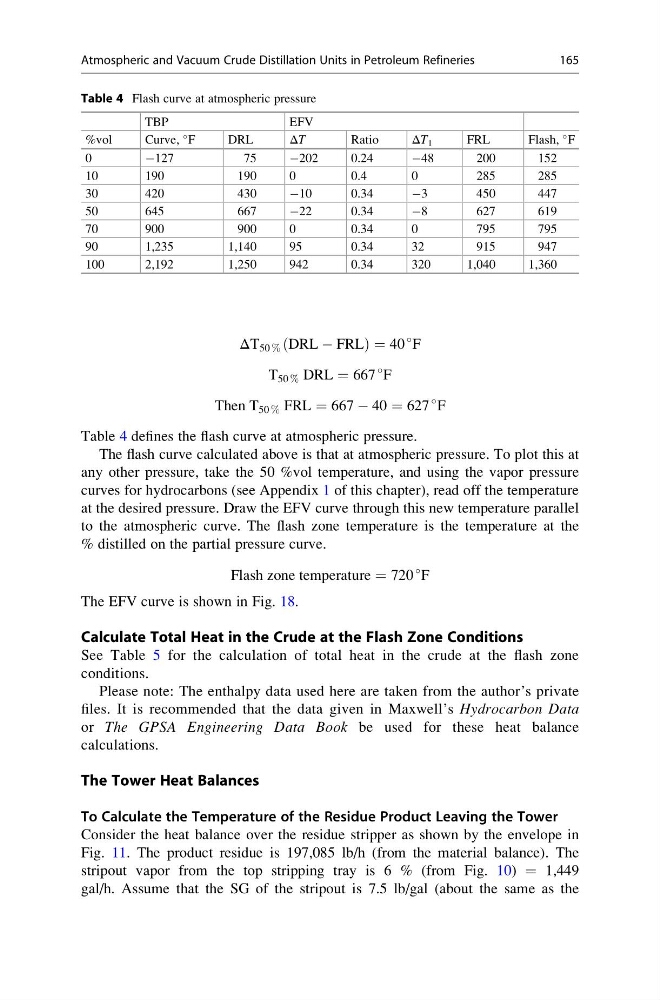
Table 4 defines the flash curve at atmospheric pressure.
The flash curve calculated above is that at atmospheric pressure. To plot this at
any other pressure, take the 50 %vol temperature, and using the vapor pressure
curves for hydrocarbons (see Appendix 1 of this chapter), read off the temperature
at the desired pressure. Draw the EFV curve through this new temperature parallel
to the atmospheric curve. The flash zone temperature is the temperature at the
% distilled on the partial pressure curve.
Flash zone temperature ¼ 720
F
The EFV curve is shown in Fig. 18.
Calculate Total Heat in the Crude at the Flash Zone Conditions
See Table 5 for the calculation of total heat in the crude at the flash zone
conditions.
Please note: The enthalpy data used here are taken from the author’s private
files. It is recommended that the data given in Maxwell’s Hydrocarbon Data
or The GPSA Engineering Data Book be used for these heat balance
calculations.
The Tower Heat Balances
To Calculate the Temperature of the Residue Product Leaving the Tower
Consider the heat balance over the residue stripper as shown by the envelope in
Fig. 11. The product residue is 197,085 lb/h (from the material balance). The
stripout vapor from the top stripping tray is 6 % (from Fig. 10) = 1,449
gal/h. Assume that the SG of the stripout is 7.5 lb/gal (about the same as the
Table 4 Flash curve at atmospheric pressure
TBP
EFV
%vol
Curve,
F
DRL
ΔT
Ratio
ΔT 1
FRL
Flash,
F
0
À127
75
À202
0.24
À48
200
152
10
190
190
0
0.4
0
285
285
30
420
430
À10
0.34
À3
450
447
50
645
667
À22
0.34
À8
627
619
70
900
900
0
0.34
0
795
795
90
1,235
1,140
95
0.34
32
915
947
100
2,192
1,250
942
0.34
320
1,040
1,360
Atmospheric and Vacuum Crude Distillation Units in Petroleum Refineries
165
ð
Þ¼40
F
T 50 % DRL ¼ 667
F
Then T 50 % FRL ¼ 667 À 40 ¼ 627
F
Table 4 defines the flash curve at atmospheric pressure.
The flash curve calculated above is that at atmospheric pressure. To plot this at
any other pressure, take the 50 %vol temperature, and using the vapor pressure
curves for hydrocarbons (see Appendix 1 of this chapter), read off the temperature
at the desired pressure. Draw the EFV curve through this new temperature parallel
to the atmospheric curve. The flash zone temperature is the temperature at the
% distilled on the partial pressure curve.
Flash zone temperature ¼ 720
F
The EFV curve is shown in Fig. 18.
Calculate Total Heat in the Crude at the Flash Zone Conditions
See Table 5 for the calculation of total heat in the crude at the flash zone
conditions.
Please note: The enthalpy data used here are taken from the author’s private
files. It is recommended that the data given in Maxwell’s Hydrocarbon Data
or The GPSA Engineering Data Book be used for these heat balance
calculations.
The Tower Heat Balances
To Calculate the Temperature of the Residue Product Leaving the Tower
Consider the heat balance over the residue stripper as shown by the envelope in
Fig. 11. The product residue is 197,085 lb/h (from the material balance). The
stripout vapor from the top stripping tray is 6 % (from Fig. 10) = 1,449
gal/h. Assume that the SG of the stripout is 7.5 lb/gal (about the same as the
Table 4 Flash curve at atmospheric pressure
TBP
EFV
%vol
Curve,
F
DRL
ΔT
Ratio
ΔT 1
FRL
Flash,
F
0
À127
75
À202
0.24
À48
200
152
10
190
190
0
0.4
0
285
285
30
420
430
À10
0.34
À3
450
447
50
645
667
À22
0.34
À8
627
619
70
900
900
0
0.34
0
795
795
90
1,235
1,140
95
0.34
32
915
947
100
2,192
1,250
942
0.34
320
1,040
1,360
Atmospheric and Vacuum Crude Distillation Units in Petroleum Refineries
165