

feed to the catalytic reformer) from a particular crude feed source also sets the
performance parameters of the unit. This includes the amount of reflux to be
generated, at which section this reflux is to be generated, distillate drawoff temperatures, tower overhead conditions, flash zone conditions, and the like.
Whole Crude TBP Curve and Assay Data
The development of the unit’s material balance begins with an “in-depth” examination and analysis of the crude oil feed assay. The first step in doing this activity is
to break up the crude feed TBP distillation curve into its pseudo components and to
assign the product characteristics relative to each component’s mid boiling point or
mid volume point on crude.
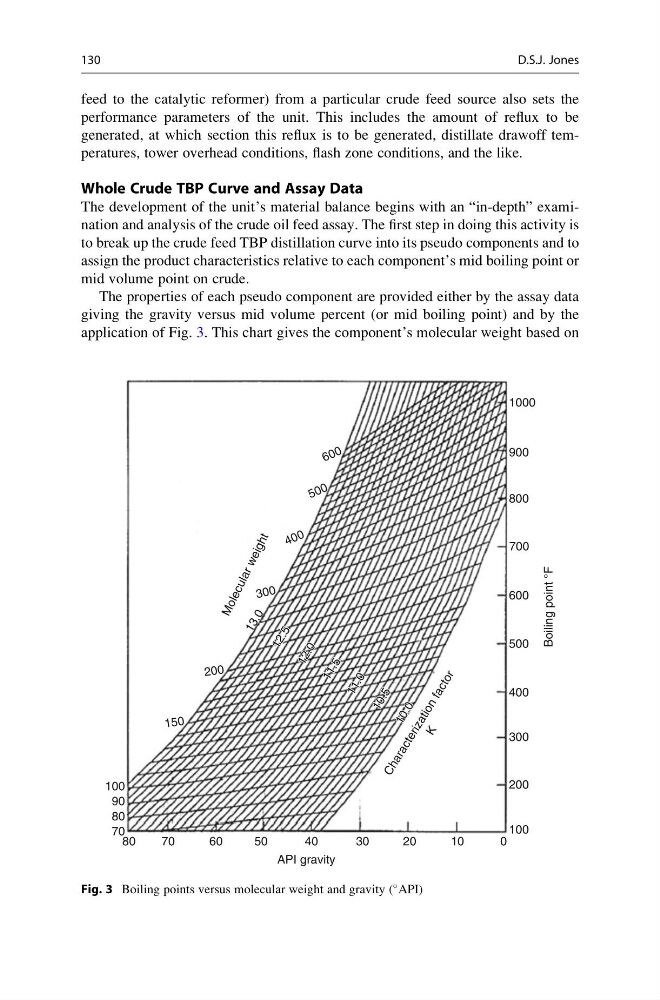
The properties of each pseudo component are provided either by the assay data
giving the gravity versus mid volume percent (or mid boiling point) and by the
application of Fig. 3. This chart gives the component’s molecular weight based on
1000
900
800
700
600
Boiling point °F
M o le c u la r w e ig h t
500
400
300
200
100
0
10
20
30
40
50
API gravity
C h a r a c t e r iz a t io n f a c t o r
K
60
70
80
70
80
90
100
15 0
20 0
30 0
4 0 0
5 0 0
6 0 0
1 0 . 0
1 0 . 0
1 0 . 5
1 0 . 5
1 1 . 0
1 1 . 0
1 1 . 5
1 1 . 5
1 2 . 0
1 2 . 0
1 2 . 5
1 2 . 5
1 0 . 0
1 0 . 5
1 1 . 0
1 1 . 5
1 2 . 0
1 2 . 5
1 3 . 0
Fig. 3 Boiling points versus molecular weight and gravity (
API)
130
D.S.J. Jones
performance parameters of the unit. This includes the amount of reflux to be
generated, at which section this reflux is to be generated, distillate drawoff temperatures, tower overhead conditions, flash zone conditions, and the like.
Whole Crude TBP Curve and Assay Data
The development of the unit’s material balance begins with an “in-depth” examination and analysis of the crude oil feed assay. The first step in doing this activity is
to break up the crude feed TBP distillation curve into its pseudo components and to
assign the product characteristics relative to each component’s mid boiling point or
mid volume point on crude.
The properties of each pseudo component are provided either by the assay data
giving the gravity versus mid volume percent (or mid boiling point) and by the
application of Fig. 3. This chart gives the component’s molecular weight based on
1000
900
800
700
600
Boiling point °F
M o le c u la r w e ig h t
500
400
300
200
100
0
10
20
30
40
50
API gravity
C h a r a c t e r iz a t io n f a c t o r
K
60
70
80
70
80
90
100
15 0
20 0
30 0
4 0 0
5 0 0
6 0 0
1 0 . 0
1 0 . 0
1 0 . 5
1 0 . 5
1 1 . 0
1 1 . 0
1 1 . 5
1 1 . 5
1 2 . 0
1 2 . 0
1 2 . 5
1 2 . 5
1 0 . 0
1 0 . 5
1 1 . 0
1 1 . 5
1 2 . 0
1 2 . 5
1 3 . 0
Fig. 3 Boiling points versus molecular weight and gravity (
API)
130
D.S.J. Jones