

Product Blending and Properties
i. Gasoline blending. Both grades of gasoline will be blended to a “no give away”
on octane value. These grades and their blending specifications are given in
Table 35.
ii. Premium grade gasoline. The blend of gasoline precursor streams shown in
Table 37 meets the octane specifications and quantity for the premium grade
gasoline.
The remaining properties of this product are developed in the following:
iii. The distillation curves. The TBP curves for each precursor making up the blend
are divided into components of the same boiling range and combined to produce
the composite TBP curve for the blend. Refer to Tables 38 and 39 for these data.
RVP blending factors are in Table 39.
The TBP and the derived ASTM curves are given in Fig. 12.
The component breakdown will now be used to determine the SG of the product
and the quantity of C 4 that will be added to the blend to meet the RVP spec.
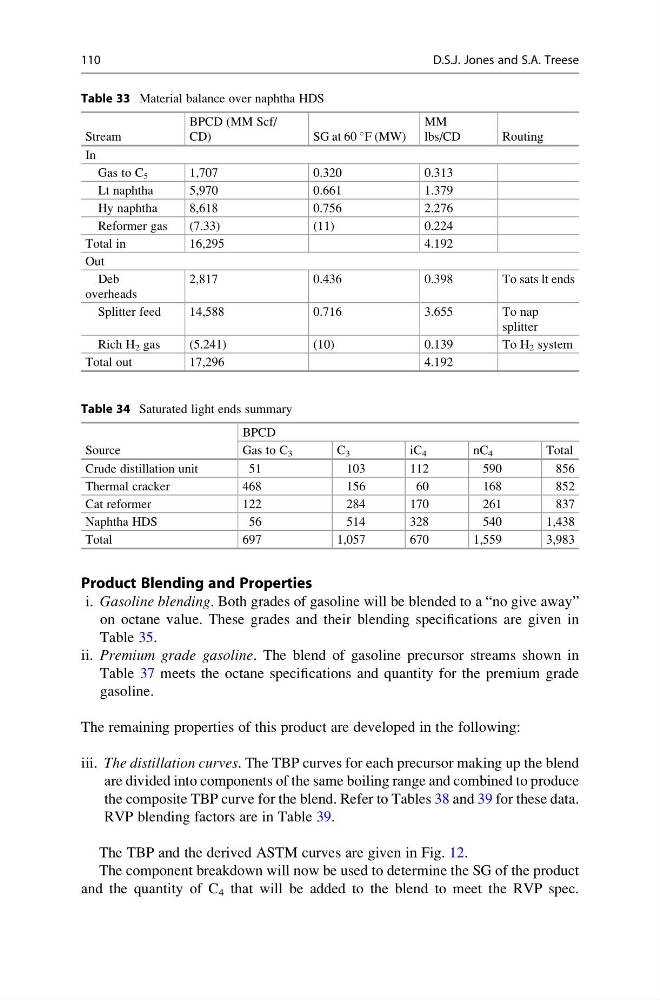
Table 33 Material balance over naphtha HDS
Stream
BPCD (MM Scf/
CD)
SG at 60
F (MW)
MM
lbs/CD
Routing
In
Gas to C 5
1,707
0.320
0.313
Lt naphtha
5,970
0.661
1.379
Hy naphtha
8,618
0.756
2.276
Reformer gas
(7.33)
(11)
0.224
Total in
16,295
4.192
Out
Deb
overheads
2,817
0.436
0.398
To sats lt ends
Splitter feed
14,588
0.716
3.655
To nap
splitter
Rich H 2 gas
(5.241)
(10)
0.139
To H 2 system
Total out
17,296
4.192
Table 34 Saturated light ends summary
Source
BPCD
Gas to C 3
C 3
iC 4
nC 4
Total
Crude distillation unit
51
103
112
590
856
Thermal cracker
468
156
60
168
852
Cat reformer
122
284
170
261
837
Naphtha HDS
56
514
328
540
1,438
Total
697
1,057
670
1,559
3,983
110
D.S.J. Jones and S.A. Treese
i. Gasoline blending. Both grades of gasoline will be blended to a “no give away”
on octane value. These grades and their blending specifications are given in
Table 35.
ii. Premium grade gasoline. The blend of gasoline precursor streams shown in
Table 37 meets the octane specifications and quantity for the premium grade
gasoline.
The remaining properties of this product are developed in the following:
iii. The distillation curves. The TBP curves for each precursor making up the blend
are divided into components of the same boiling range and combined to produce
the composite TBP curve for the blend. Refer to Tables 38 and 39 for these data.
RVP blending factors are in Table 39.
The TBP and the derived ASTM curves are given in Fig. 12.
The component breakdown will now be used to determine the SG of the product
and the quantity of C 4 that will be added to the blend to meet the RVP spec.
Table 33 Material balance over naphtha HDS
Stream
BPCD (MM Scf/
CD)
SG at 60
F (MW)
MM
lbs/CD
Routing
In
Gas to C 5
1,707
0.320
0.313
Lt naphtha
5,970
0.661
1.379
Hy naphtha
8,618
0.756
2.276
Reformer gas
(7.33)
(11)
0.224
Total in
16,295
4.192
Out
Deb
overheads
2,817
0.436
0.398
To sats lt ends
Splitter feed
14,588
0.716
3.655
To nap
splitter
Rich H 2 gas
(5.241)
(10)
0.139
To H 2 system
Total out
17,296
4.192
Table 34 Saturated light ends summary
Source
BPCD
Gas to C 3
C 3
iC 4
nC 4
Total
Crude distillation unit
51
103
112
590
856
Thermal cracker
468
156
60
168
852
Cat reformer
122
284
170
261
837
Naphtha HDS
56
514
328
540
1,438
Total
697
1,057
670
1,559
3,983
110
D.S.J. Jones and S.A. Treese