

Appendix 2: Product Upgrades Based on Minimum Expected Quality Loss 341
deal with the larger-the-better case is slightly different from that for the
smaller-the-better and nominal-the-better cases. However, for each quality
characteristic there exists some function that uniquely defines the relationship between economic loss and the deviation of the quality characteristic
from its target value. Taguchi found the quadratic representation of the quality
loss function to be an efficient and effective way to assess the loss due to
deviation of a quality characteristic from its target value. For a product with
a target value m, from a customers’ perspective, m ± Δ 0 represents the deviation at which functional failure of the product or component occurs. When a
product is manufactured with its quality characteristic at the extremes,
m + Δ 0 or m − Δ 0 , some measure to counter the loss must be undertaken by the
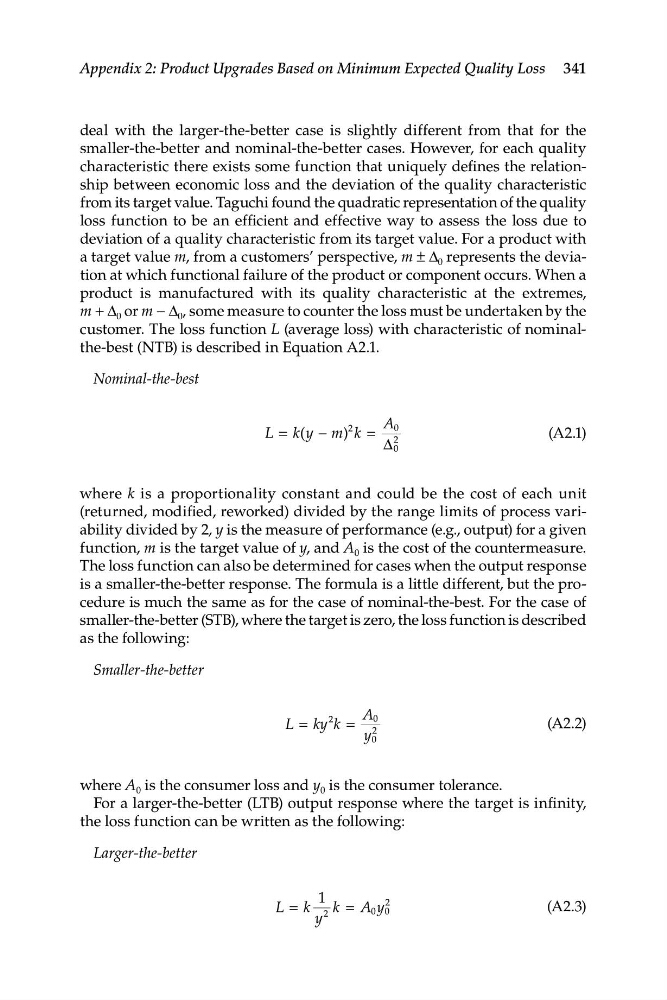
customer. The loss function L (average loss) with characteristic of nominalthe-best (NTB) is described in Equation A2.1.
Nominal-the-best
A 0
L = k y − m k =
(A2.1)
(
)
2
Δ 0
2
where k is a proportionality constant and could be the cost of each unit
(returned, modified, reworked) divided by the range limits of process variability divided by 2, y is the measure of performance (e.g., output) for a given
function, m is the target value of y, and A 0 is the cost of the countermeasure.
The loss function can also be determined for cases when the output response
is a smaller-the-better response. The formula is a little different, but the procedure is much the same as for the case of nominal-the-best. For the case of
smaller-the-better (STB), where the target is zero, the loss function is described
as the following:
Smaller-the-better
2
A
L = ky k = 2
0
(A2.2)
y 0
where A 0 is the consumer loss and y 0 is the consumer tolerance.
For a larger-the-better (LTB) output response where the target is infinity,
the loss function can be written as the following:
Larger-the-better
1
2
L = k 2 k = A y
(A2.3)
0 0
y
deal with the larger-the-better case is slightly different from that for the
smaller-the-better and nominal-the-better cases. However, for each quality
characteristic there exists some function that uniquely defines the relationship between economic loss and the deviation of the quality characteristic
from its target value. Taguchi found the quadratic representation of the quality
loss function to be an efficient and effective way to assess the loss due to
deviation of a quality characteristic from its target value. For a product with
a target value m, from a customers’ perspective, m ± Δ 0 represents the deviation at which functional failure of the product or component occurs. When a
product is manufactured with its quality characteristic at the extremes,
m + Δ 0 or m − Δ 0 , some measure to counter the loss must be undertaken by the
customer. The loss function L (average loss) with characteristic of nominalthe-best (NTB) is described in Equation A2.1.
Nominal-the-best
A 0
L = k y − m k =
(A2.1)
(
)
2
Δ 0
2
where k is a proportionality constant and could be the cost of each unit
(returned, modified, reworked) divided by the range limits of process variability divided by 2, y is the measure of performance (e.g., output) for a given
function, m is the target value of y, and A 0 is the cost of the countermeasure.
The loss function can also be determined for cases when the output response
is a smaller-the-better response. The formula is a little different, but the procedure is much the same as for the case of nominal-the-best. For the case of
smaller-the-better (STB), where the target is zero, the loss function is described
as the following:
Smaller-the-better
2
A
L = ky k = 2
0
(A2.2)
y 0
where A 0 is the consumer loss and y 0 is the consumer tolerance.
For a larger-the-better (LTB) output response where the target is infinity,
the loss function can be written as the following:
Larger-the-better
1
2
L = k 2 k = A y
(A2.3)
0 0
y