

observe from this figure that the base reservoir event
(blue solid line) is shifted slightly downwards, by
2–3 ms. This slowdown is interpreted as a velocity
drop caused by the pore pressure increase in the
segment.
Figure 19.22 shows an attempt to discriminate
between fluid saturation changes and pressure changes
for this compartment using the method described in
Landrø (2001). In 1996, 27% of the estimated recoverable reserves in this segment had been produced, so
we know that some fluid saturation changes should be
observable on the 4D seismic data.
From this figure we see that in the western part of
the segment most of the estimated fluid saturation
changes occur close to the oil/water contact. However,
some scattered anomalies can be observed beyond the
oil/water contact in the northern part of the segment.
These anomalies are probably caused by inaccuracies
in the algorithm or by limited repeatability of the timelapse AVO data. The estimated pressure changes are
more consistent with the fault pattern in the region,
and it is likely that the pressure increase is confined
between faults in almost all directions. Later timelapse surveys show that the eastern fault in the figure
was “opened” some years later.
1985
OWC
C-3
Top Cook
1996
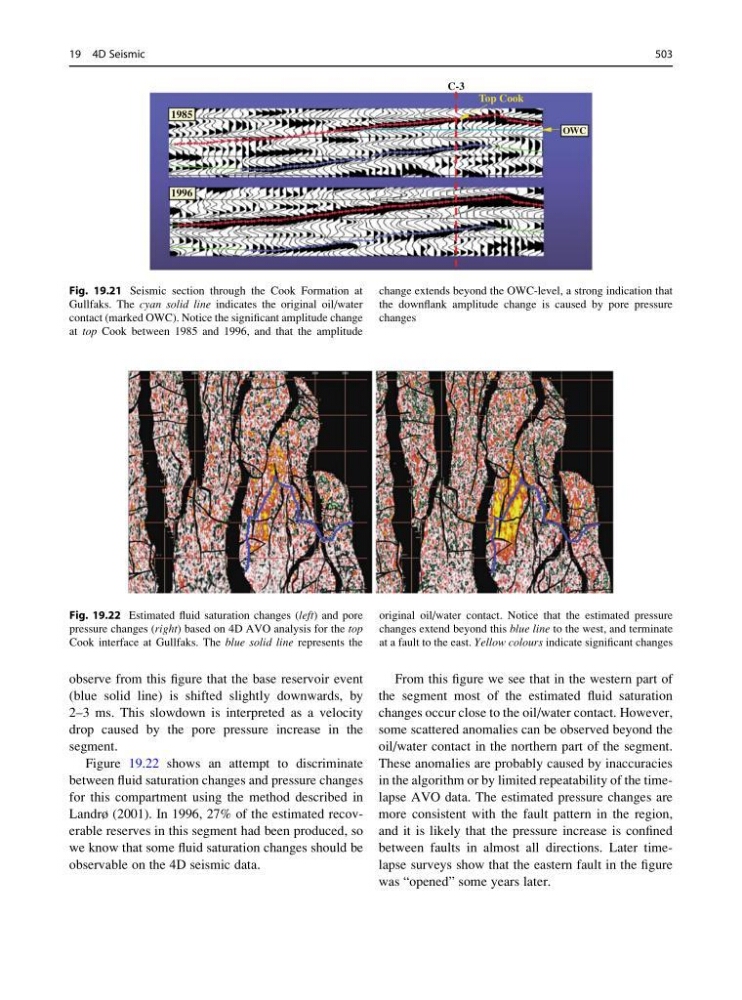
Fig. 19.21 Seismic section through the Cook Formation at
Gullfaks. The cyan solid line indicates the original oil/water
contact (marked OWC). Notice the significant amplitude change
at top Cook between 1985 and 1996, and that the amplitude
change extends beyond the OWC-level, a strong indication that
the downflank amplitude change is caused by pore pressure
changes
Fig. 19.22 Estimated fluid saturation changes (left) and pore
pressure changes (right) based on 4D AVO analysis for the top
Cook interface at Gullfaks. The blue solid line represents the
original oil/water contact. Notice that the estimated pressure
changes extend beyond this blue line to the west, and terminate
at a fault to the east. Yellow colours indicate significant changes
19 4D Seismic
503
(blue solid line) is shifted slightly downwards, by
2–3 ms. This slowdown is interpreted as a velocity
drop caused by the pore pressure increase in the
segment.
Figure 19.22 shows an attempt to discriminate
between fluid saturation changes and pressure changes
for this compartment using the method described in
Landrø (2001). In 1996, 27% of the estimated recoverable reserves in this segment had been produced, so
we know that some fluid saturation changes should be
observable on the 4D seismic data.
From this figure we see that in the western part of
the segment most of the estimated fluid saturation
changes occur close to the oil/water contact. However,
some scattered anomalies can be observed beyond the
oil/water contact in the northern part of the segment.
These anomalies are probably caused by inaccuracies
in the algorithm or by limited repeatability of the timelapse AVO data. The estimated pressure changes are
more consistent with the fault pattern in the region,
and it is likely that the pressure increase is confined
between faults in almost all directions. Later timelapse surveys show that the eastern fault in the figure
was “opened” some years later.
1985
OWC
C-3
Top Cook
1996
Fig. 19.21 Seismic section through the Cook Formation at
Gullfaks. The cyan solid line indicates the original oil/water
contact (marked OWC). Notice the significant amplitude change
at top Cook between 1985 and 1996, and that the amplitude
change extends beyond the OWC-level, a strong indication that
the downflank amplitude change is caused by pore pressure
changes
Fig. 19.22 Estimated fluid saturation changes (left) and pore
pressure changes (right) based on 4D AVO analysis for the top
Cook interface at Gullfaks. The blue solid line represents the
original oil/water contact. Notice that the estimated pressure
changes extend beyond this blue line to the west, and terminate
at a fault to the east. Yellow colours indicate significant changes
19 4D Seismic
503