

80
® LOW-SINUOSITY
RIVER
taccretion Surfaces
orientation of
cross� bedding
,
orientation of
cross-bedding
. _,... .. . dip-strike of accretion surface
ori entation of cross-bedding
exposed active bars
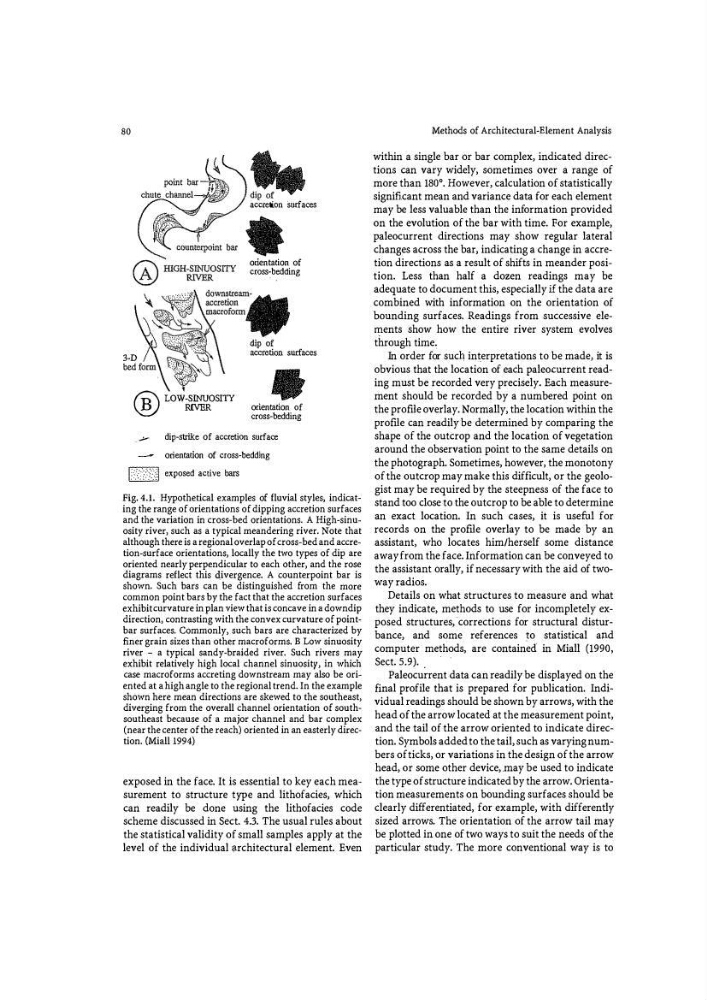
Fig. 4.1. Hypothetical examples of fluvial styles, indicating the range of orientations of dipping accretion surfaces
and the variation in cross-bed orientations. A High-sinuosity river, such as a typical meandering river. Note that
although there is a regional overlap of cross-bed and accretion-surface orientations, locally the two types of dip are
oriented nearly perpendicular to each other, and the rose
diagrams reflect this 4ivergence. A counterpoint bar is
shown. Such bars can be distinguished fr om the more
common point bars by the fact that the accretion surfaces
exhibit curvature in plan view that is concave in a down dip
direction, contrasting with the convex curvature of pointbar surfaces. Commonly, such bars are characterized by
finer grain sizes than other macroforms. B Low sinuosity
river - a typical sandy-braided river. Such rivers may
exhibit relatively high local channel sinuosity, in which
case macroforms accreting downstream may also be oriented at a high angle to the regional trend. In the example
shown here mean directions are skewed to the southeast,
diverging from the overall channel orientation of southsoutheast because of a major channel and bar complex
(near the center of the reach) oriented in an easterly direction. (Miall l994)
exposed in the face. It is essential to key each measurement to structure type and lithofacies, which
can readily be done using the lithofacies code
scheme discussed in Sect. 4.3. The usual rules about
the statistical validity of small samples apply at the
level of the individual �rchitectural element. Even
Methods of Architectural-Element Analysis
within a single bar or bar complex, indicated directions can vary widely, sometimes over a range of
more than 180°. However, calculation of statistically
significant mean and variance data for each element
may be less valuable than the information provided
on the evolution of the bar with time. For example,
paleocurrent directions may show regular lateral
changes across the bar, indicating a change in accretion directions as a result of shifts in meander position. Less than half a dozen readings may be
adequate to document this, especially if the data are
combined with information on the orientation of
bounding surfaces. Readings from successive elen:tents show how the entire river system evolves
through time ..
In order for such interpretations to be made, it is
obvious that the location of each paleocurrent reading must be recorded very precisely. Each measurement should be recorded by a numbered point on
the profile overlay. Normally, the location within the
profile can readily be determined by comparing the
shape of the outcrop and the location of vegetation
around the observation point to the same details on
the photograph. Sometimes, however, the monotony
of the outcrop may make this difficult, or the geologist may be required by the steepness of the face to
stand too close to the outcrop to be able to determine
an exact location. In such cases, it is useful for
records on the profile overlay to be made by an
assistant, who locates him/herself some distance
away from the face. Information can be conveyed to
the assistant orally, if necessary with the aid of twoway radios.
Details on what structures to measure and what
they indicate, methods to use for incompletely exposed structures, ·corrections for structural disturbance, and some references �o statistical and
computer methods, are contained in Miall (1990,
Sect. 5.9) . .
Paleocurrent data can readily be displayed on the
final profile that is prepared for publication. Individual readings should be shown by arrows, with the
head of the arrow located at the measurement point,
and the tail of the arrow oriented to indicate direction. Symbols added to the tail, such as varying numbers of ticks, or variations in the design of the arrow
head, or some other device, .may be used to indicate
the type of structure indicated by the arrow. Orientation measurements on bounding surfaces should be
clearly differentiated, for example, with differently
sized arrows. The orientation of the arrow tail may
be plotted in one of two ways to suit the needs of the
particular study. The more conventional way is to
® LOW-SINUOSITY
RIVER
taccretion Surfaces
orientation of
cross� bedding
,
orientation of
cross-bedding
. _,... .. . dip-strike of accretion surface
ori entation of cross-bedding
exposed active bars
Fig. 4.1. Hypothetical examples of fluvial styles, indicating the range of orientations of dipping accretion surfaces
and the variation in cross-bed orientations. A High-sinuosity river, such as a typical meandering river. Note that
although there is a regional overlap of cross-bed and accretion-surface orientations, locally the two types of dip are
oriented nearly perpendicular to each other, and the rose
diagrams reflect this 4ivergence. A counterpoint bar is
shown. Such bars can be distinguished fr om the more
common point bars by the fact that the accretion surfaces
exhibit curvature in plan view that is concave in a down dip
direction, contrasting with the convex curvature of pointbar surfaces. Commonly, such bars are characterized by
finer grain sizes than other macroforms. B Low sinuosity
river - a typical sandy-braided river. Such rivers may
exhibit relatively high local channel sinuosity, in which
case macroforms accreting downstream may also be oriented at a high angle to the regional trend. In the example
shown here mean directions are skewed to the southeast,
diverging from the overall channel orientation of southsoutheast because of a major channel and bar complex
(near the center of the reach) oriented in an easterly direction. (Miall l994)
exposed in the face. It is essential to key each measurement to structure type and lithofacies, which
can readily be done using the lithofacies code
scheme discussed in Sect. 4.3. The usual rules about
the statistical validity of small samples apply at the
level of the individual �rchitectural element. Even
Methods of Architectural-Element Analysis
within a single bar or bar complex, indicated directions can vary widely, sometimes over a range of
more than 180°. However, calculation of statistically
significant mean and variance data for each element
may be less valuable than the information provided
on the evolution of the bar with time. For example,
paleocurrent directions may show regular lateral
changes across the bar, indicating a change in accretion directions as a result of shifts in meander position. Less than half a dozen readings may be
adequate to document this, especially if the data are
combined with information on the orientation of
bounding surfaces. Readings from successive elen:tents show how the entire river system evolves
through time ..
In order for such interpretations to be made, it is
obvious that the location of each paleocurrent reading must be recorded very precisely. Each measurement should be recorded by a numbered point on
the profile overlay. Normally, the location within the
profile can readily be determined by comparing the
shape of the outcrop and the location of vegetation
around the observation point to the same details on
the photograph. Sometimes, however, the monotony
of the outcrop may make this difficult, or the geologist may be required by the steepness of the face to
stand too close to the outcrop to be able to determine
an exact location. In such cases, it is useful for
records on the profile overlay to be made by an
assistant, who locates him/herself some distance
away from the face. Information can be conveyed to
the assistant orally, if necessary with the aid of twoway radios.
Details on what structures to measure and what
they indicate, methods to use for incompletely exposed structures, ·corrections for structural disturbance, and some references �o statistical and
computer methods, are contained in Miall (1990,
Sect. 5.9) . .
Paleocurrent data can readily be displayed on the
final profile that is prepared for publication. Individual readings should be shown by arrows, with the
head of the arrow located at the measurement point,
and the tail of the arrow oriented to indicate direction. Symbols added to the tail, such as varying numbers of ticks, or variations in the design of the arrow
head, or some other device, .may be used to indicate
the type of structure indicated by the arrow. Orientation measurements on bounding surfaces should be
clearly differentiated, for example, with differently
sized arrows. The orientation of the arrow tail may
be plotted in one of two ways to suit the needs of the
particular study. The more conventional way is to