

Paleovalley Fields (PV Type)
younger, because fluvial channels are by their very
nature erosive. Modern delta distributaries are
known to scour for several meters below base level
into associated delta-front deposits. The scale of the
incised channel may be suggestive. Individual active
channels, such as delta distributaries, are typically a
few hundred meters wide, whereas paleovalleys may
be significantly larger (a few kilometers wide) and
contain composite fills indicating several periods of
incision and infilling. A close comparison of fades
and petrography between the fluvial channels and
the host strata might suggest a close genetic association (e.g., delta distributaries within an active delta)
but does not conclusively prove such a relationship.
Consideration of the succession in a regional sequence-stratigraphic context is probably the most
r'eliable method of interpretation.
Eight separate valley-fill levels have been identified in the Little Bow area (Fig. 15.1). Initially, these
were interpreted by Hopkins et al. (1982) as being
delta distributaries, but later work has indicated that
an estuarine interpretation is more realistic (Wood
and Hopkins 1989, 1992). Some of the valley fills
have been traced for more than 50 km. They are 2-2.5
km wide and up to 30 m deep (Fig. 15.1) They contain
three main fades: sandstone, sandstone-shale interbeds, and shale. The shale contains evidence of
marine trace fossils, and the sandstone includes
sand-mud couplets interpreted as tidal in origin.
Wood and Hopkins (1989) compared the facies and
distribution of the beds to those of the modern estuarine sediments of the Gironde Estu a ry, France.
They suggested that the valley filled by fluvial and
subsequent estuarine sedimentation following ap eriod of base-level lowering and downcutting.
Details of one of the valley fills at Little Bow
(valley 2 in Fig. 15.1b), at the bend in the channel, are
shown in the detailed map of Fig. 14.6, and Fig. 14.7
provides a stratigraphic cross section through the
Little Bow field. Three separate pools (G, U, and W)
have been delineated. Proof of their separation is
based on two lines of evidence: (a) The shale caprock
that separates the pool has been penetrated by cores
in several wells and has been shown to occupy the
entire stratigraphic interval of the valley fill. (b) Each
pool has different pressures and oil-gas contact elevations (Wood and Hopkins 1989). The pools may
also be separated on the basis of seismic evidence, as
shown in Fig. 15.2. The pools each represent major
sand banks that formed within the estuary. They
may have been contemporaneous, or they may
represent separate periods of incision and valley
499
filling. Wood and Hopkins (1989) preferred the first
of these interpretations and pointed to the simultaneous, juxtaposed development of sand bars and
mud banks in the Gironde Estuary. Figure 9.72 illustrates fl uid-flow paths through a cross section of
this field, inferred from data obtained during waterflooding of the field.
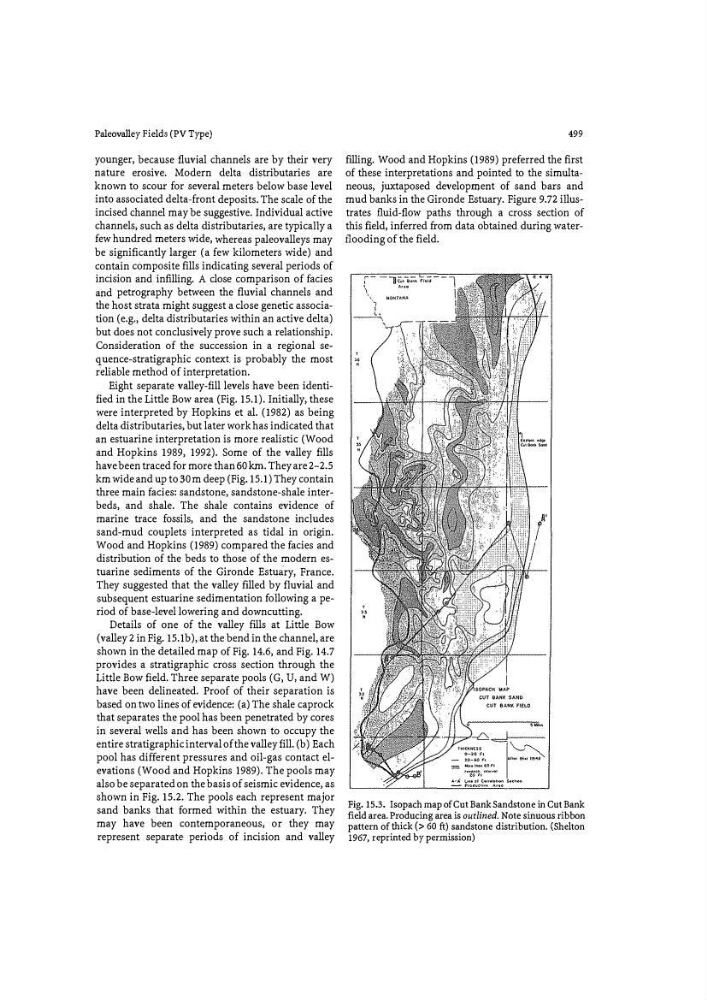
Fig. 15.3. Isopach map of Cut Bank Sandstone in Cut Bank
field area. Producing area is outlined. Note sinuous ribbon
pattern of thick (> 60 ft) sandstone distribution. (Shelton
1967, reprinted by permission)