

52
Statistical Methods for Estimating Petroleum Resources
conceptual plays. However, before we describe the matching process, a
number of prerequisites need to be explained.
Distributions of individual pools can be displayed conveniently
without much loss of information as a few selected upper percentiles.
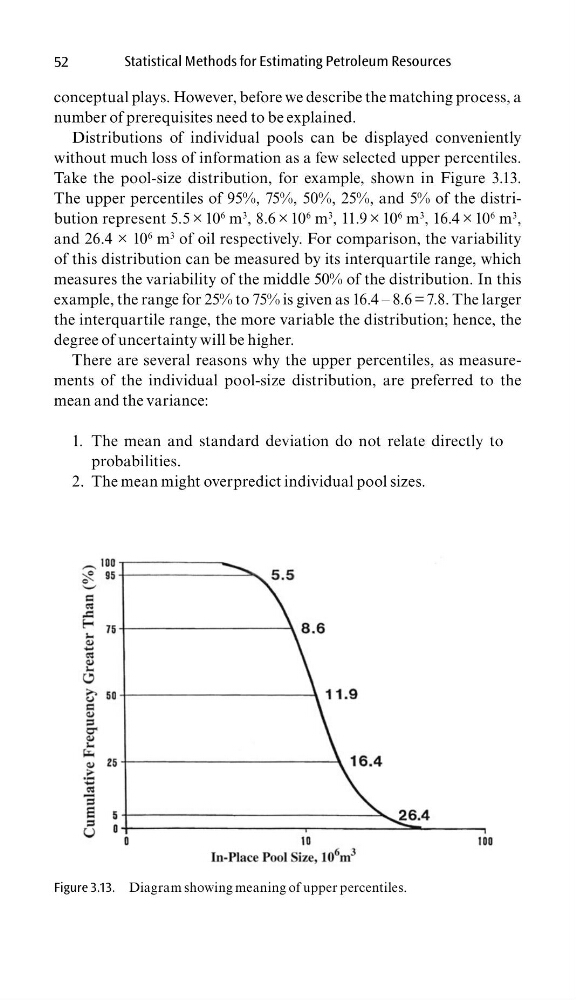
Take the pool-size distribution, for example, shown in Figure 3.13.
The upper percentiles of 95%, 75%, 50%, 25%, and 5% of the distribution represent 5.5 × 10
6 m
3 , 8.6 × 10
6 m
3 , 11.9 × 10
6 m
3 , 16.4 × 10
6 m
3 ,
and 26.4 × 10
6 m
3 of oil respectively. For comparison, the variability
of this distribution can be measured by its interquartile range, which
measures the variability of the middle 50% of the distribution. In this
example, the range for 25% to 75% is given as 16.4 – 8.6 = 7.8. The larger
the interquartile range, the more variable the distribution; hence, the
degree of uncertainty will be higher.
There are several reasons why the upper percentiles, as measurements of the individual pool-size distribution, are preferred to the
mean and the variance:
The mean and standard deviation do not relate directly to
1.
probabilities.
The mean might overpredict individual pool sizes.
2.
Figure 3.13. Diagram showing meaning of upper percentiles.
Statistical Methods for Estimating Petroleum Resources
conceptual plays. However, before we describe the matching process, a
number of prerequisites need to be explained.
Distributions of individual pools can be displayed conveniently
without much loss of information as a few selected upper percentiles.
Take the pool-size distribution, for example, shown in Figure 3.13.
The upper percentiles of 95%, 75%, 50%, 25%, and 5% of the distribution represent 5.5 × 10
6 m
3 , 8.6 × 10
6 m
3 , 11.9 × 10
6 m
3 , 16.4 × 10
6 m
3 ,
and 26.4 × 10
6 m
3 of oil respectively. For comparison, the variability
of this distribution can be measured by its interquartile range, which
measures the variability of the middle 50% of the distribution. In this
example, the range for 25% to 75% is given as 16.4 – 8.6 = 7.8. The larger
the interquartile range, the more variable the distribution; hence, the
degree of uncertainty will be higher.
There are several reasons why the upper percentiles, as measurements of the individual pool-size distribution, are preferred to the
mean and the variance:
The mean and standard deviation do not relate directly to
1.
probabilities.
The mean might overpredict individual pool sizes.
2.
Figure 3.13. Diagram showing meaning of upper percentiles.