

Evaluation Models
13
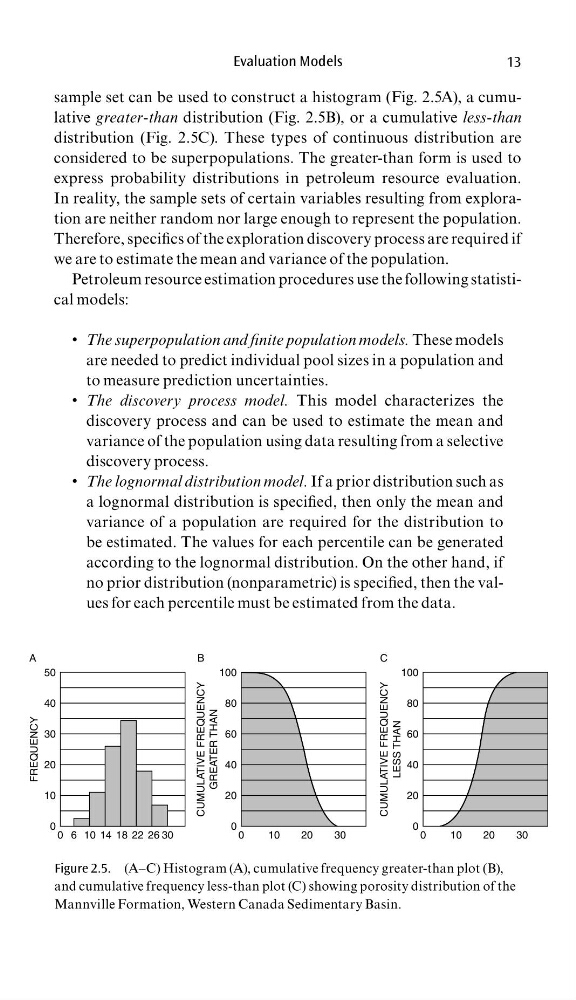
sample set can be used to construct a histogram (Fig. 2.5A), a cumulative greater-than distribution (Fig. 2.5B), or a cumulative less-than
distribution (Fig. 2.5C). These types of continuous distribution are
considered to be superpopulations. The greater-than form is used to
express probability distributions in petroleum resource evaluation.
In reality, the sample sets of certain variables resulting from exploration are neither random nor large enough to represent the population.
Therefore, specifi cs of the exploration discovery process are required if
we are to estimate the mean and variance of the population.
Petroleum resource estimation procedures use the following statistical models:
The superpopulation and fi nite population models.
•
These models
are needed to predict individual pool sizes in a population and
to measure prediction uncertainties.
The discovery process model.
•
This model characterizes the
discovery process and can be used to estimate the mean and
variance of the population using data resulting from a selective
discovery process.
The lognormal distribution model.
•
If a prior distribution such as
a lognormal distribution is specifi ed, then only the mean and
variance of a population are required for the distribution to
be estimated. The values for each percentile can be generated
according to the lognormal distribution. On the other hand, if
no prior distribution (nonparametric) is specifi ed, then the values for each percentile must be estimated from the data.
0
0
20
40
60
80
100
10
20
CUMULATIVE FREQUENCY
LESS THAN
0
20
40
60
80
100
CUMULATIVE FREQUENCY
GREATER THAN
0
10
20
30
40
50
A
B
C
FREQUENCY
30
0
0 6 10 14 18 22 26
10
20
30
30
Figure 2.5. (A–C) Histogram (A), cumulative frequency greater-than plot (B),
and cumulative frequency less-than plot (C) showing porosity distribution of the
Mannville Formation, Western Canada Sedimentary Basin.
13
sample set can be used to construct a histogram (Fig. 2.5A), a cumulative greater-than distribution (Fig. 2.5B), or a cumulative less-than
distribution (Fig. 2.5C). These types of continuous distribution are
considered to be superpopulations. The greater-than form is used to
express probability distributions in petroleum resource evaluation.
In reality, the sample sets of certain variables resulting from exploration are neither random nor large enough to represent the population.
Therefore, specifi cs of the exploration discovery process are required if
we are to estimate the mean and variance of the population.
Petroleum resource estimation procedures use the following statistical models:
The superpopulation and fi nite population models.
•
These models
are needed to predict individual pool sizes in a population and
to measure prediction uncertainties.
The discovery process model.
•
This model characterizes the
discovery process and can be used to estimate the mean and
variance of the population using data resulting from a selective
discovery process.
The lognormal distribution model.
•
If a prior distribution such as
a lognormal distribution is specifi ed, then only the mean and
variance of a population are required for the distribution to
be estimated. The values for each percentile can be generated
according to the lognormal distribution. On the other hand, if
no prior distribution (nonparametric) is specifi ed, then the values for each percentile must be estimated from the data.
0
0
20
40
60
80
100
10
20
CUMULATIVE FREQUENCY
LESS THAN
0
20
40
60
80
100
CUMULATIVE FREQUENCY
GREATER THAN
0
10
20
30
40
50
A
B
C
FREQUENCY
30
0
0 6 10 14 18 22 26
10
20
30
30
Figure 2.5. (A–C) Histogram (A), cumulative frequency greater-than plot (B),
and cumulative frequency less-than plot (C) showing porosity distribution of the
Mannville Formation, Western Canada Sedimentary Basin.