

90
Statistical Methods for Estimating Petroleum Resources
Long or Short Tails at Both Ends
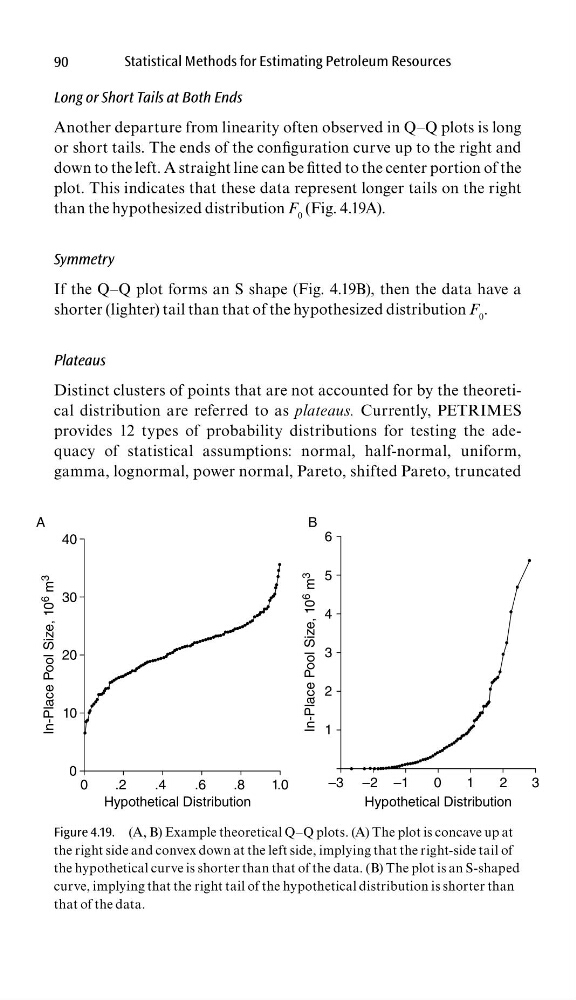
Another departure from linearity often observed in Q–Q plots is long
or short tails. The ends of the confi guration curve up to the right and
down to the left. A straight line can be fi tted to the center portion of the
plot. This indicates that these data represent longer tails on the right
than the hypothesized distribution F 0 (Fig. 4.19A).
Symmetry
If the Q–Q plot forms an S shape (Fig. 4.19B), then the data have a
shorter (lighter) tail than that of the hypothesized distribution F 0 .
Plateaus
Distinct clusters of points that are not accounted for by the theoretical distribution are referred to as plateaus. Currently, PETRIMES
provides 12 types of probability distributions for testing the adequacy of statistical assumptions: normal, half-normal, uniform,
gamma, lognormal, power normal, Pareto, shifted Pareto, truncated
40
6
5
4
3
2
1
30
20
10
In-Place Pool Size, 10 6
m 3
In-Place Pool Size, 10 6
m 3
0
A
B
0
.2
.4
.6
Hypothetical Distribution
Hypothetical Distribution
.8
1.0
–3 –2 –1
0
1
2
3
Figure 4.19. (A, B) Example theoretical Q–Q plots. (A) The plot is concave up at
the right side and convex down at the left side, implying that the right-side tail of
the hypothetical curve is shorter than that of the data. (B) The plot is an S-shaped
curve, implying that the right tail of the hypothetical distribution is shorter than
that of the data.
Statistical Methods for Estimating Petroleum Resources
Long or Short Tails at Both Ends
Another departure from linearity often observed in Q–Q plots is long
or short tails. The ends of the confi guration curve up to the right and
down to the left. A straight line can be fi tted to the center portion of the
plot. This indicates that these data represent longer tails on the right
than the hypothesized distribution F 0 (Fig. 4.19A).
Symmetry
If the Q–Q plot forms an S shape (Fig. 4.19B), then the data have a
shorter (lighter) tail than that of the hypothesized distribution F 0 .
Plateaus
Distinct clusters of points that are not accounted for by the theoretical distribution are referred to as plateaus. Currently, PETRIMES
provides 12 types of probability distributions for testing the adequacy of statistical assumptions: normal, half-normal, uniform,
gamma, lognormal, power normal, Pareto, shifted Pareto, truncated
40
6
5
4
3
2
1
30
20
10
In-Place Pool Size, 10 6
m 3
In-Place Pool Size, 10 6
m 3
0
A
B
0
.2
.4
.6
Hypothetical Distribution
Hypothetical Distribution
.8
1.0
–3 –2 –1
0
1
2
3
Figure 4.19. (A, B) Example theoretical Q–Q plots. (A) The plot is concave up at
the right side and convex down at the left side, implying that the right-side tail of
the hypothetical curve is shorter than that of the data. (B) The plot is an S-shaped
curve, implying that the right tail of the hypothetical distribution is shorter than
that of the data.