

86
Statistical Methods for Estimating Petroleum Resources
Impact of a Nonproductive Trap
Another question that has been raised is: How do the methods handle a
case when pools have been deposited, but were subsequently destroyed
by geological processes before exploration began? In this case will the
discovery process models predict the pools destroyed by nature? The
1000
100
1000
100
10
10
1
1
0.1
0.1
0.01
46
46
48 50 52 61 67 83
Pre-1994
Pre-1994
200
128
1815
1917
95th to 5th percentile
Total play resource
Pre-1965
In-Place Pool Size, 10 6
m 3
Pre-1965
85 88
49
51 56 64 82 84
86
48
50
52 56 63
47
2000
1600
In-Place Volume, 10 6
m 3
1200
800
400
0
49
51 55 60 64
A
B
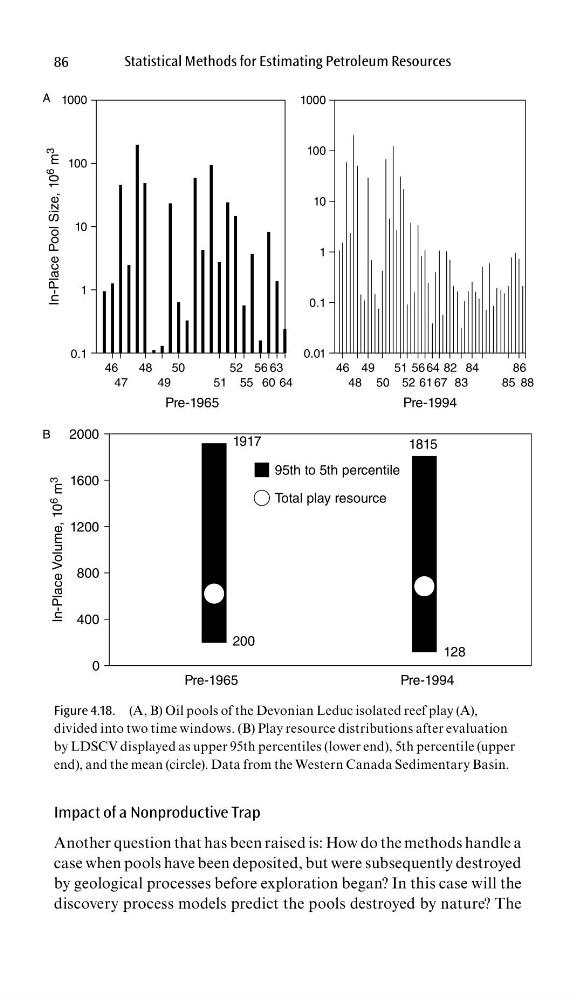
Figure 4.18. (A, B) Oil pools of the Devonian Leduc isolated reef play (A),
divided into two time windows. (B) Play resource distributions after evaluation
by LDSCV displayed as upper 95th percentiles (lower end), 5th percentile (upper
end), and the mean (circle). Data from the Western Canada Sedimentary Basin.
Statistical Methods for Estimating Petroleum Resources
Impact of a Nonproductive Trap
Another question that has been raised is: How do the methods handle a
case when pools have been deposited, but were subsequently destroyed
by geological processes before exploration began? In this case will the
discovery process models predict the pools destroyed by nature? The
1000
100
1000
100
10
10
1
1
0.1
0.1
0.01
46
46
48 50 52 61 67 83
Pre-1994
Pre-1994
200
128
1815
1917
95th to 5th percentile
Total play resource
Pre-1965
In-Place Pool Size, 10 6
m 3
Pre-1965
85 88
49
51 56 64 82 84
86
48
50
52 56 63
47
2000
1600
In-Place Volume, 10 6
m 3
1200
800
400
0
49
51 55 60 64
A
B
Figure 4.18. (A, B) Oil pools of the Devonian Leduc isolated reef play (A),
divided into two time windows. (B) Play resource distributions after evaluation
by LDSCV displayed as upper 95th percentiles (lower end), 5th percentile (upper
end), and the mean (circle). Data from the Western Canada Sedimentary Basin.