

More about Discovery Process Models
83
Figure 4.18A. The play resource distributions for the two windows are
shown in Figure 4.18B. The 0.9 probability prediction intervals for the
time windows of each play are similar.
Remarks
Assessment results are controlled by two factors: the quality of the
pool reserves booked at the time of assessment and the number of discoveries available for the assessment. Gas and oil pool appreciation
100000
100000
10000
10000
5000
5000
1000
1000
100
10
100000
10000
1000
100
10
1
500
In-Place Pool Size 10
6
m
3
100
22 52 56 58
22
44 53 57
59
61 66 68
52 56 58
60 62
60 62 67 72
26
44 58 61 68 73 75 77 79 82 85
56 59 66 72 74 76 78 80 83 88
61
59
Pre-1966
Pre-1974
Pre-1991
Pre-1966
Pre-1974
Pre-1991
57
53
44
800
95th to 5th percentile
Total play resource
700
600
500
400
300
In-Place Volume, 10
9
m
3
200
279
525
730
183
210
630
100
A
B
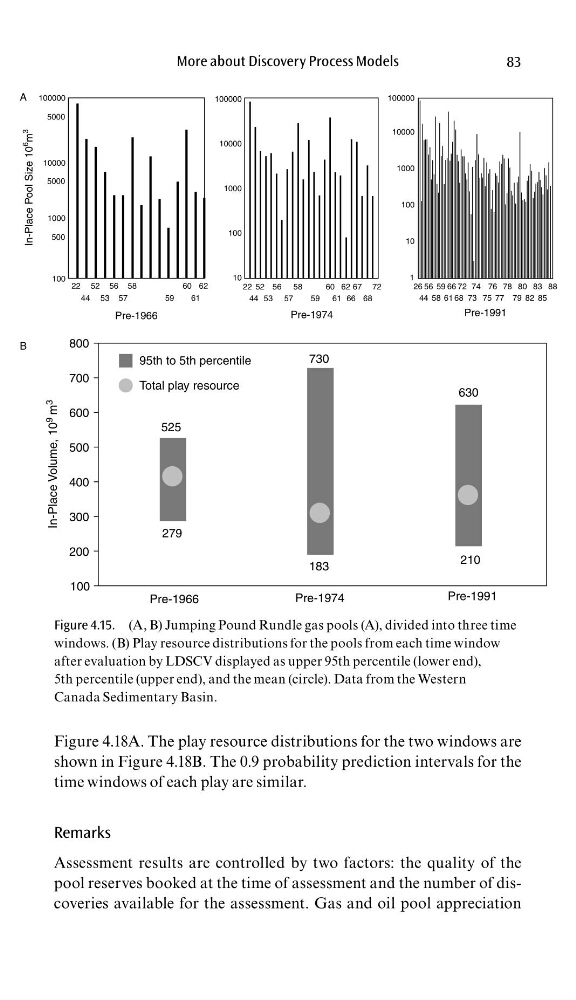
Figure 4.15. (A, B) Jumping Pound Rundle gas pools (A), divided into three time
windows. (B) Play resource distributions for the pools from each time window
after evaluation by LDSCV displayed as upper 95th percentile (lower end),
5th percentile (upper end), and the mean (circle). Data from the Western
Canada Sedimentary Basin.
83
Figure 4.18A. The play resource distributions for the two windows are
shown in Figure 4.18B. The 0.9 probability prediction intervals for the
time windows of each play are similar.
Remarks
Assessment results are controlled by two factors: the quality of the
pool reserves booked at the time of assessment and the number of discoveries available for the assessment. Gas and oil pool appreciation
100000
100000
10000
10000
5000
5000
1000
1000
100
10
100000
10000
1000
100
10
1
500
In-Place Pool Size 10
6
m
3
100
22 52 56 58
22
44 53 57
59
61 66 68
52 56 58
60 62
60 62 67 72
26
44 58 61 68 73 75 77 79 82 85
56 59 66 72 74 76 78 80 83 88
61
59
Pre-1966
Pre-1974
Pre-1991
Pre-1966
Pre-1974
Pre-1991
57
53
44
800
95th to 5th percentile
Total play resource
700
600
500
400
300
In-Place Volume, 10
9
m
3
200
279
525
730
183
210
630
100
A
B
Figure 4.15. (A, B) Jumping Pound Rundle gas pools (A), divided into three time
windows. (B) Play resource distributions for the pools from each time window
after evaluation by LDSCV displayed as upper 95th percentile (lower end),
5th percentile (upper end), and the mean (circle). Data from the Western
Canada Sedimentary Basin.