

80
Z. Yu et al.
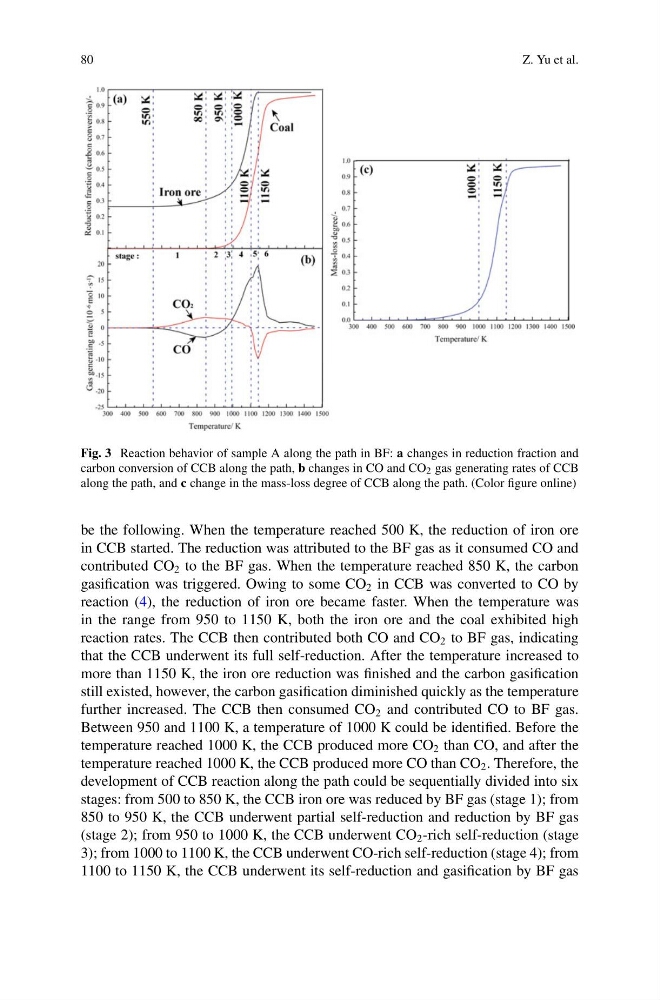
Fig. 3 Reaction behavior of sample A along the path in BF: a changes in reduction fraction and
carbon conversion of CCB along the path, b changes in CO and CO 2 gas generating rates of CCB
along the path, and c change in the mass-loss degree of CCB along the path. (Color figure online)
be the following. When the temperature reached 500 K, the reduction of iron ore
in CCB started. The reduction was attributed to the BF gas as it consumed CO and
contributed CO 2 to the BF gas. When the temperature reached 850 K, the carbon
gasification was triggered. Owing to some CO 2 in CCB was converted to CO by
reaction (4), the reduction of iron ore became faster. When the temperature was
in the range from 950 to 1150 K, both the iron ore and the coal exhibited high
reaction rates. The CCB then contributed both CO and CO 2 to BF gas, indicating
that the CCB underwent its full self-reduction. After the temperature increased to
more than 1150 K, the iron ore reduction was finished and the carbon gasification
still existed, however, the carbon gasification diminished quickly as the temperature
further increased. The CCB then consumed CO 2 and contributed CO to BF gas.
Between 950 and 1100 K, a temperature of 1000 K could be identified. Before the
temperature reached 1000 K, the CCB produced more CO 2 than CO, and after the
temperature reached 1000 K, the CCB produced more CO than CO 2 . Therefore, the
development of CCB reaction along the path could be sequentially divided into six
stages: from 500 to 850 K, the CCB iron ore was reduced by BF gas (stage 1); from
850 to 950 K, the CCB underwent partial self-reduction and reduction by BF gas
(stage 2); from 950 to 1000 K, the CCB underwent CO 2 -rich self-reduction (stage
3); from 1000 to 1100 K, the CCB underwent CO-rich self-reduction (stage 4); from
1100 to 1150 K, the CCB underwent its self-reduction and gasification by BF gas
Z. Yu et al.
Fig. 3 Reaction behavior of sample A along the path in BF: a changes in reduction fraction and
carbon conversion of CCB along the path, b changes in CO and CO 2 gas generating rates of CCB
along the path, and c change in the mass-loss degree of CCB along the path. (Color figure online)
be the following. When the temperature reached 500 K, the reduction of iron ore
in CCB started. The reduction was attributed to the BF gas as it consumed CO and
contributed CO 2 to the BF gas. When the temperature reached 850 K, the carbon
gasification was triggered. Owing to some CO 2 in CCB was converted to CO by
reaction (4), the reduction of iron ore became faster. When the temperature was
in the range from 950 to 1150 K, both the iron ore and the coal exhibited high
reaction rates. The CCB then contributed both CO and CO 2 to BF gas, indicating
that the CCB underwent its full self-reduction. After the temperature increased to
more than 1150 K, the iron ore reduction was finished and the carbon gasification
still existed, however, the carbon gasification diminished quickly as the temperature
further increased. The CCB then consumed CO 2 and contributed CO to BF gas.
Between 950 and 1100 K, a temperature of 1000 K could be identified. Before the
temperature reached 1000 K, the CCB produced more CO 2 than CO, and after the
temperature reached 1000 K, the CCB produced more CO than CO 2 . Therefore, the
development of CCB reaction along the path could be sequentially divided into six
stages: from 500 to 850 K, the CCB iron ore was reduced by BF gas (stage 1); from
850 to 950 K, the CCB underwent partial self-reduction and reduction by BF gas
(stage 2); from 950 to 1000 K, the CCB underwent CO 2 -rich self-reduction (stage
3); from 1000 to 1100 K, the CCB underwent CO-rich self-reduction (stage 4); from
1100 to 1150 K, the CCB underwent its self-reduction and gasification by BF gas