

Experimental Study on Dust Removal Performance …
45
0.0024
0.0036
0.0048
0.0060
0.0072
120
150
180
210
240
270
300
330
360
390
G/
m⋅h
-1
L/G
A
B
C
D
E
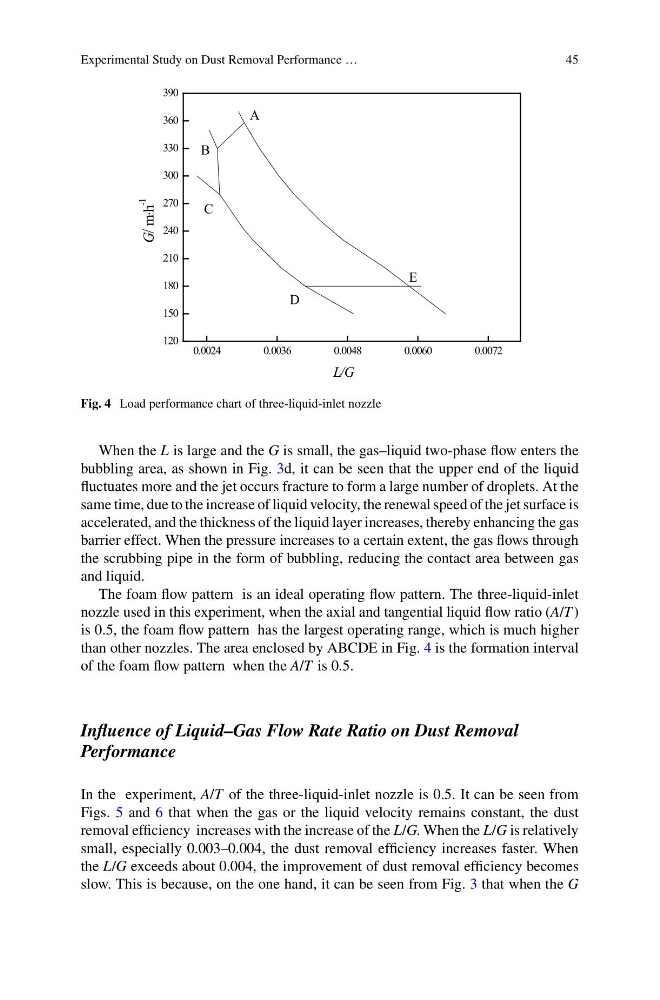
Fig. 4 Load performance chart of three-liquid-inlet nozzle
When the L is large and the G is small, the gas–liquid two-phase flow enters the
bubbling area, as shown in Fig. 3d, it can be seen that the upper end of the liquid
fluctuates more and the jet occurs fracture to form a large number of droplets. At the
same time, due to the increase of liquid velocity, the renewal speed of the jet surface is
accelerated, and the thickness of the liquid layer increases, thereby enhancing the gas
barrier effect. When the pressure increases to a certain extent, the gas flows through
the scrubbing pipe in the form of bubbling, reducing the contact area between gas
and liquid.
The foam flow pattern is an ideal operating flow pattern. The three-liquid-inlet
nozzle used in this experiment, when the axial and tangential liquid flow ratio (A/T )
is 0.5, the foam flow pattern has the largest operating range, which is much higher
than other nozzles. The area enclosed by ABCDE in Fig. 4 is the formation interval
of the foam flow pattern when the A/T is 0.5.
Influence of Liquid–Gas Flow Rate Ratio on Dust Removal
Performance
In the experiment, A/T of the three-liquid-inlet nozzle is 0.5. It can be seen from
Figs. 5 and 6 that when the gas or the liquid velocity remains constant, the dust
removal efficiency increases with the increase of the L/G. When the L/G is relatively
small, especially 0.003–0.004, the dust removal efficiency increases faster. When
the L/G exceeds about 0.004, the improvement of dust removal efficiency becomes
slow. This is because, on the one hand, it can be seen from Fig. 3 that when the G
45
0.0024
0.0036
0.0048
0.0060
0.0072
120
150
180
210
240
270
300
330
360
390
G/
m⋅h
-1
L/G
A
B
C
D
E
Fig. 4 Load performance chart of three-liquid-inlet nozzle
When the L is large and the G is small, the gas–liquid two-phase flow enters the
bubbling area, as shown in Fig. 3d, it can be seen that the upper end of the liquid
fluctuates more and the jet occurs fracture to form a large number of droplets. At the
same time, due to the increase of liquid velocity, the renewal speed of the jet surface is
accelerated, and the thickness of the liquid layer increases, thereby enhancing the gas
barrier effect. When the pressure increases to a certain extent, the gas flows through
the scrubbing pipe in the form of bubbling, reducing the contact area between gas
and liquid.
The foam flow pattern is an ideal operating flow pattern. The three-liquid-inlet
nozzle used in this experiment, when the axial and tangential liquid flow ratio (A/T )
is 0.5, the foam flow pattern has the largest operating range, which is much higher
than other nozzles. The area enclosed by ABCDE in Fig. 4 is the formation interval
of the foam flow pattern when the A/T is 0.5.
Influence of Liquid–Gas Flow Rate Ratio on Dust Removal
Performance
In the experiment, A/T of the three-liquid-inlet nozzle is 0.5. It can be seen from
Figs. 5 and 6 that when the gas or the liquid velocity remains constant, the dust
removal efficiency increases with the increase of the L/G. When the L/G is relatively
small, especially 0.003–0.004, the dust removal efficiency increases faster. When
the L/G exceeds about 0.004, the improvement of dust removal efficiency becomes
slow. This is because, on the one hand, it can be seen from Fig. 3 that when the G