

154
Z. Tang et al.
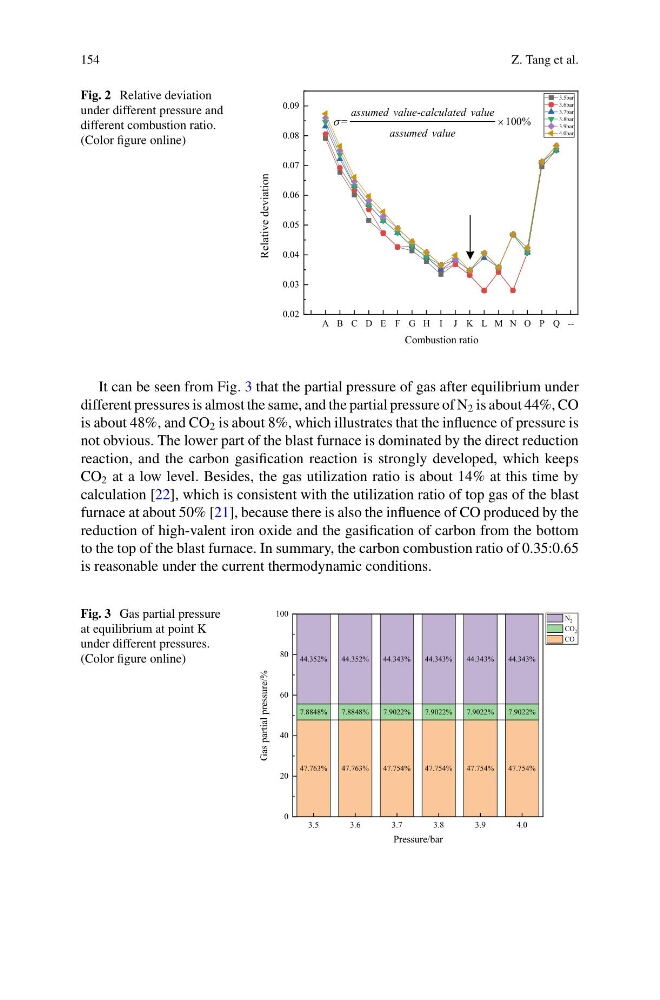
Fig. 2 Relative deviation
under different pressure and
different combustion ratio.
(Color figure online)
A B C D E F G H I J K L M N O P Q -0.02
0.03
0.04
0.05
0.06
0.07
0.08
0.09
Relative deviation
Combustion ratio
3.5bar
3.6bar
3.7bar
3.8bar
3.9bar
4.0bar
-
100%
=
assumed value calculated value
assumed value
It can be seen from Fig. 3 that the partial pressure of gas after equilibrium under
different pressures is almost the same, and the partial pressure of N 2 is about 44%, CO
is about 48%, and CO 2 is about 8%, which illustrates that the influence of pressure is
not obvious. The lower part of the blast furnace is dominated by the direct reduction
reaction, and the carbon gasification reaction is strongly developed, which keeps
CO 2 at a low level. Besides, the gas utilization ratio is about 14% at this time by
calculation [22], which is consistent with the utilization ratio of top gas of the blast
furnace at about 50% [21], because there is also the influence of CO produced by the
reduction of high-valent iron oxide and the gasification of carbon from the bottom
to the top of the blast furnace. In summary, the carbon combustion ratio of 0.35:0.65
is reasonable under the current thermodynamic conditions.
Fig. 3 Gas partial pressure
at equilibrium at point K
under different pressures.
(Color figure online)
47.763%
47.763%
47.754%
47.754%
47.754%
47.754%
7.8848%
7.8848%
7.9022%
7.9022%
7.9022%
7.9022%
44.352%
44.352%
44.343%
44.343%
44.343%
44.343%
3.5
3.6
3.7
3.8
3.9
4.0
0
20
40
60
80
100
Gas partial pressure/%
Pressure/bar
N 2
CO 2
CO
Z. Tang et al.
Fig. 2 Relative deviation
under different pressure and
different combustion ratio.
(Color figure online)
A B C D E F G H I J K L M N O P Q -0.02
0.03
0.04
0.05
0.06
0.07
0.08
0.09
Relative deviation
Combustion ratio
3.5bar
3.6bar
3.7bar
3.8bar
3.9bar
4.0bar
-
100%
=
assumed value calculated value
assumed value
It can be seen from Fig. 3 that the partial pressure of gas after equilibrium under
different pressures is almost the same, and the partial pressure of N 2 is about 44%, CO
is about 48%, and CO 2 is about 8%, which illustrates that the influence of pressure is
not obvious. The lower part of the blast furnace is dominated by the direct reduction
reaction, and the carbon gasification reaction is strongly developed, which keeps
CO 2 at a low level. Besides, the gas utilization ratio is about 14% at this time by
calculation [22], which is consistent with the utilization ratio of top gas of the blast
furnace at about 50% [21], because there is also the influence of CO produced by the
reduction of high-valent iron oxide and the gasification of carbon from the bottom
to the top of the blast furnace. In summary, the carbon combustion ratio of 0.35:0.65
is reasonable under the current thermodynamic conditions.
Fig. 3 Gas partial pressure
at equilibrium at point K
under different pressures.
(Color figure online)
47.763%
47.763%
47.754%
47.754%
47.754%
47.754%
7.8848%
7.8848%
7.9022%
7.9022%
7.9022%
7.9022%
44.352%
44.352%
44.343%
44.343%
44.343%
44.343%
3.5
3.6
3.7
3.8
3.9
4.0
0
20
40
60
80
100
Gas partial pressure/%
Pressure/bar
N 2
CO 2
CO