

Simulation and Optimization of Defluorination and Desulfurization …
125
of 150,000–200000Nm
3 /h as the prototype, the ratio of the prototype to model was
determined to be 50:1. The inner diameter of the filler tower is 100 mm and the height
of the packed section is 720 mm.
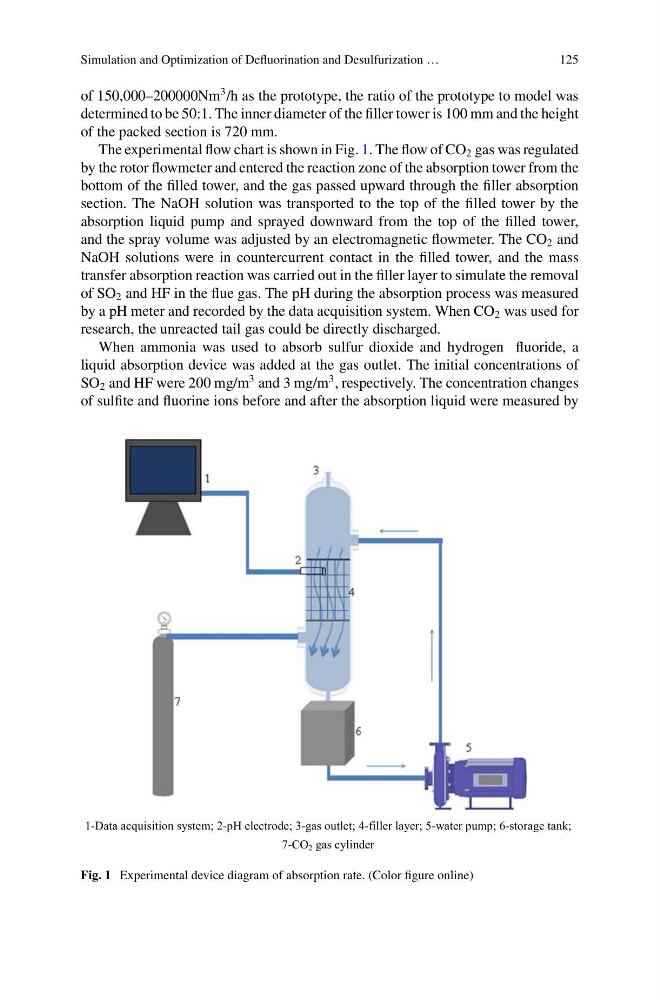
The experimental flow chart is shown in Fig. 1. The flow of CO 2 gas was regulated
by the rotor flowmeter and entered the reaction zone of the absorption tower from the
bottom of the filled tower, and the gas passed upward through the filler absorption
section. The NaOH solution was transported to the top of the filled tower by the
absorption liquid pump and sprayed downward from the top of the filled tower,
and the spray volume was adjusted by an electromagnetic flowmeter. The CO 2 and
NaOH solutions were in countercurrent contact in the filled tower, and the mass
transfer absorption reaction was carried out in the filler layer to simulate the removal
of SO 2 and HF in the flue gas. The pH during the absorption process was measured
by a pH meter and recorded by the data acquisition system. When CO 2 was used for
research, the unreacted tail gas could be directly discharged.
When ammonia was used to absorb sulfur dioxide and hydrogen fluoride, a
liquid absorption device was added at the gas outlet. The initial concentrations of
SO 2 and HF were 200 mg/m
3 and 3 mg/m
3 , respectively. The concentration changes
of sulfite and fluorine ions before and after the absorption liquid were measured by
1-Data acquisition system; 2-pH electrode; 3-gas outlet; 4-filler layer; 5-water pump; 6-storage tank;
7-CO 2 gas cylinder
Fig. 1 Experimental device diagram of absorption rate. (Color figure online)
125
of 150,000–200000Nm
3 /h as the prototype, the ratio of the prototype to model was
determined to be 50:1. The inner diameter of the filler tower is 100 mm and the height
of the packed section is 720 mm.
The experimental flow chart is shown in Fig. 1. The flow of CO 2 gas was regulated
by the rotor flowmeter and entered the reaction zone of the absorption tower from the
bottom of the filled tower, and the gas passed upward through the filler absorption
section. The NaOH solution was transported to the top of the filled tower by the
absorption liquid pump and sprayed downward from the top of the filled tower,
and the spray volume was adjusted by an electromagnetic flowmeter. The CO 2 and
NaOH solutions were in countercurrent contact in the filled tower, and the mass
transfer absorption reaction was carried out in the filler layer to simulate the removal
of SO 2 and HF in the flue gas. The pH during the absorption process was measured
by a pH meter and recorded by the data acquisition system. When CO 2 was used for
research, the unreacted tail gas could be directly discharged.
When ammonia was used to absorb sulfur dioxide and hydrogen fluoride, a
liquid absorption device was added at the gas outlet. The initial concentrations of
SO 2 and HF were 200 mg/m
3 and 3 mg/m
3 , respectively. The concentration changes
of sulfite and fluorine ions before and after the absorption liquid were measured by
1-Data acquisition system; 2-pH electrode; 3-gas outlet; 4-filler layer; 5-water pump; 6-storage tank;
7-CO 2 gas cylinder
Fig. 1 Experimental device diagram of absorption rate. (Color figure online)