

72
5 Empirical Research for Establishing the Potential of Renewable Hydrogen …
Table 5.3 (continued)
Current
China (CNREC
2019; CNREC
2019; Yang
et al. 2017)
Japan (IEA
2018b)
Korea (IEA
2018c)
Taiwan (Salt
2018)
Current solar
PV generation
(calculated) in
TWh yr −1
18
257
69
11
3
Current solar
PV generation
(from literature)
in TWh yr −1
6
178
52
5
10
Current total
RE generation
(calculated) in
TWh yr −1
37
1.131
80
14
9
Current total
RE generation
(from literature)
in TWh yr −1
18
544
58
7
13
• The market integration varies in function of the balance of dispatch, the reduced time of response, the local marginal pricing, the curtailment control and
the cross-border trade.
Though some of the factors and variables have been assumed and implemented
uniformly across the case studies (i.e. capacity factor, nameplate nominal power
of the reference wind turbine), most of them are not included in the author’s
calculations.
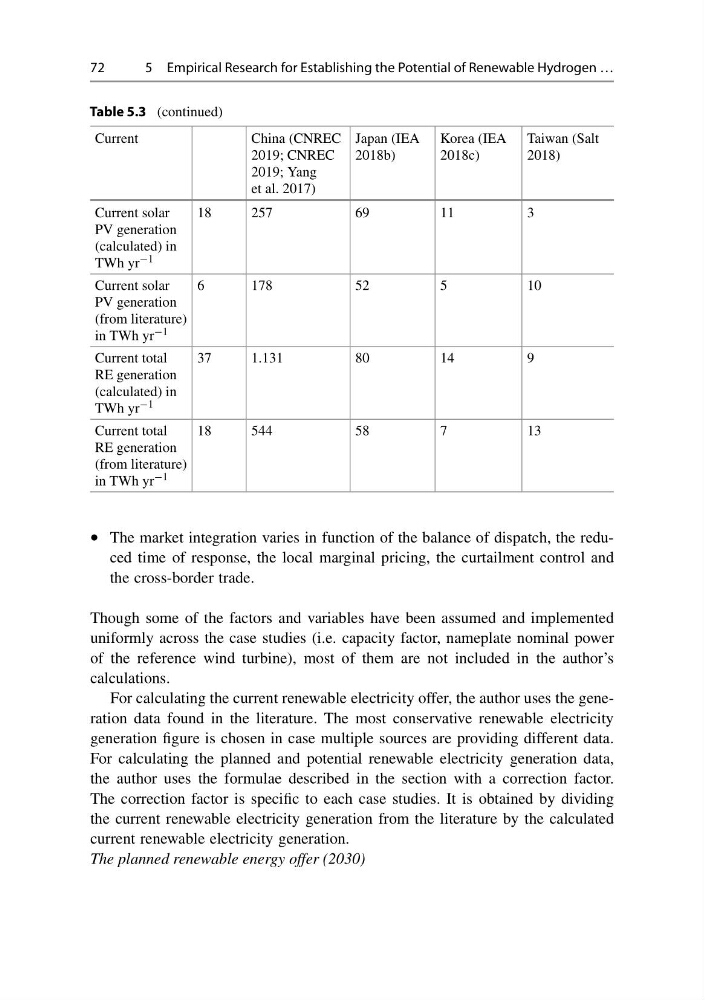
For calculating the current renewable electricity offer, the author uses the generation data found in the literature. The most conservative renewable electricity
generation figure is chosen in case multiple sources are providing different data.
For calculating the planned and potential renewable electricity generation data,
the author uses the formulae described in the section with a correction factor.
The correction factor is specific to each case studies. It is obtained by dividing
the current renewable electricity generation from the literature by the calculated
current renewable electricity generation.
The planned renewable energy offer (2030)
5 Empirical Research for Establishing the Potential of Renewable Hydrogen …
Table 5.3 (continued)
Current
China (CNREC
2019; CNREC
2019; Yang
et al. 2017)
Japan (IEA
2018b)
Korea (IEA
2018c)
Taiwan (Salt
2018)
Current solar
PV generation
(calculated) in
TWh yr −1
18
257
69
11
3
Current solar
PV generation
(from literature)
in TWh yr −1
6
178
52
5
10
Current total
RE generation
(calculated) in
TWh yr −1
37
1.131
80
14
9
Current total
RE generation
(from literature)
in TWh yr −1
18
544
58
7
13
• The market integration varies in function of the balance of dispatch, the reduced time of response, the local marginal pricing, the curtailment control and
the cross-border trade.
Though some of the factors and variables have been assumed and implemented
uniformly across the case studies (i.e. capacity factor, nameplate nominal power
of the reference wind turbine), most of them are not included in the author’s
calculations.
For calculating the current renewable electricity offer, the author uses the generation data found in the literature. The most conservative renewable electricity
generation figure is chosen in case multiple sources are providing different data.
For calculating the planned and potential renewable electricity generation data,
the author uses the formulae described in the section with a correction factor.
The correction factor is specific to each case studies. It is obtained by dividing
the current renewable electricity generation from the literature by the calculated
current renewable electricity generation.
The planned renewable energy offer (2030)