

3.2 The Concept of Energy
53
operational
machine state
time-constant states
time-variable states
time aspect
technically relevant
value-adding
non-value-adding
optimization
aspect
idle state
stand-by state
producing state
warm up state
setup state
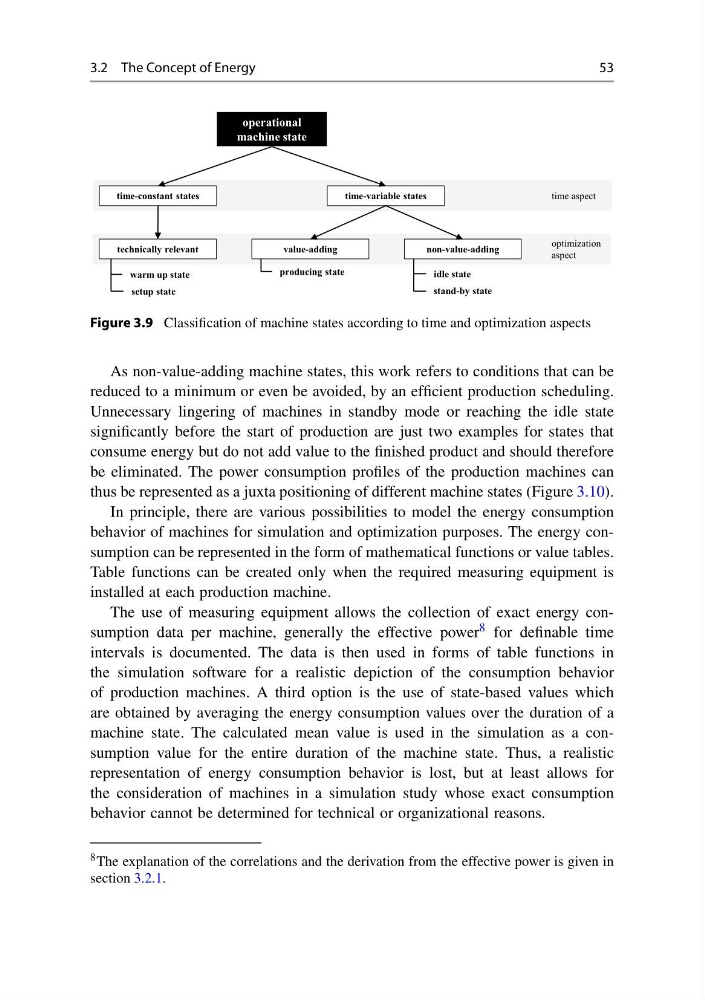
Figure 3.9 Classification of machine states according to time and optimization aspects
As non-value-adding machine states, this work refers to conditions that can be
reduced to a minimum or even be avoided, by an efficient production scheduling.
Unnecessary lingering of machines in standby mode or reaching the idle state
significantly before the start of production are just two examples for states that
consume energy but do not add value to the finished product and should therefore
be eliminated. The power consumption profiles of the production machines can
thus be represented as a juxta positioning of different machine states (Figure 3.10).
In principle, there are various possibilities to model the energy consumption
behavior of machines for simulation and optimization purposes. The energy consumption can be represented in the form of mathematical functions or value tables.
Table functions can be created only when the required measuring equipment is
installed at each production machine.
The use of measuring equipment allows the collection of exact energy consumption data per machine, generally the effective power 8 for definable time
intervals is documented. The data is then used in forms of table functions in
the simulation software for a realistic depiction of the consumption behavior
of production machines. A third option is the use of state-based values which
are obtained by averaging the energy consumption values over the duration of a
machine state. The calculated mean value is used in the simulation as a consumption value for the entire duration of the machine state. Thus, a realistic
representation of energy consumption behavior is lost, but at least allows for
the consideration of machines in a simulation study whose exact consumption
behavior cannot be determined for technical or organizational reasons.
8 The explanation of the correlations and the derivation from the effective power is given in
section 3.2.1.
53
operational
machine state
time-constant states
time-variable states
time aspect
technically relevant
value-adding
non-value-adding
optimization
aspect
idle state
stand-by state
producing state
warm up state
setup state
Figure 3.9 Classification of machine states according to time and optimization aspects
As non-value-adding machine states, this work refers to conditions that can be
reduced to a minimum or even be avoided, by an efficient production scheduling.
Unnecessary lingering of machines in standby mode or reaching the idle state
significantly before the start of production are just two examples for states that
consume energy but do not add value to the finished product and should therefore
be eliminated. The power consumption profiles of the production machines can
thus be represented as a juxta positioning of different machine states (Figure 3.10).
In principle, there are various possibilities to model the energy consumption
behavior of machines for simulation and optimization purposes. The energy consumption can be represented in the form of mathematical functions or value tables.
Table functions can be created only when the required measuring equipment is
installed at each production machine.
The use of measuring equipment allows the collection of exact energy consumption data per machine, generally the effective power 8 for definable time
intervals is documented. The data is then used in forms of table functions in
the simulation software for a realistic depiction of the consumption behavior
of production machines. A third option is the use of state-based values which
are obtained by averaging the energy consumption values over the duration of a
machine state. The calculated mean value is used in the simulation as a consumption value for the entire duration of the machine state. Thus, a realistic
representation of energy consumption behavior is lost, but at least allows for
the consideration of machines in a simulation study whose exact consumption
behavior cannot be determined for technical or organizational reasons.
8 The explanation of the correlations and the derivation from the effective power is given in
section 3.2.1.