

6.3 Optimization Experiments
189
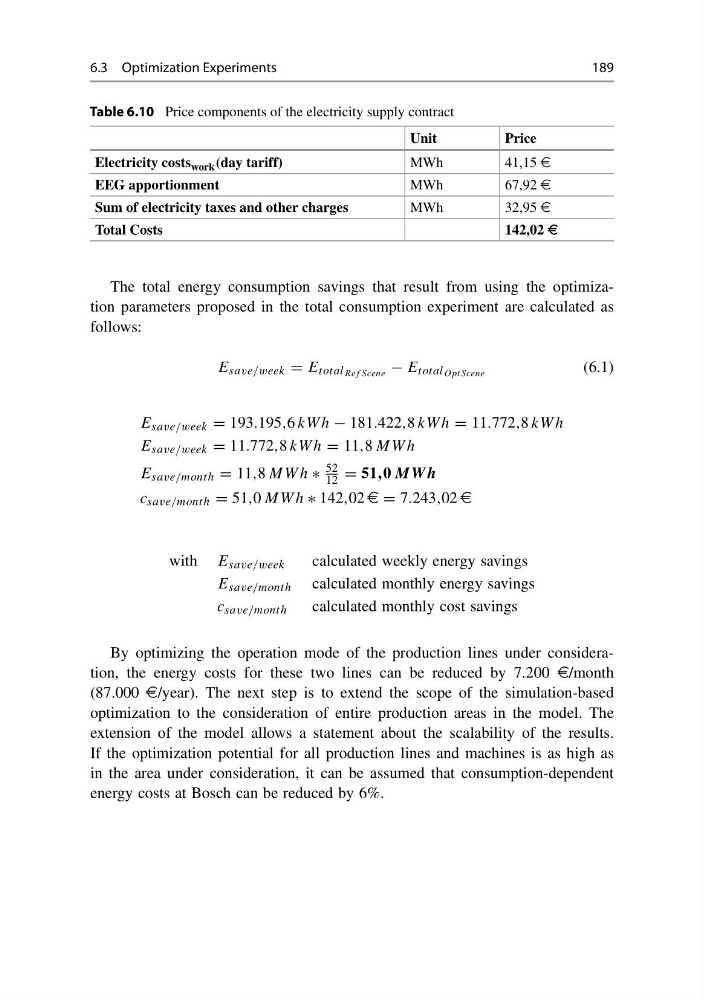
Table 6.10 Price components of the electricity supply contract
Unit
Price
Electricity costs work (day tariff)
MWh
41,15 e
EEG apportionment
MWh
67,92 e
Sum of electricity taxes and other charges
MWh
32,95 e
Total Costs
142,02 e
The total energy consumption savings that result from using the optimization parameters proposed in the total consumption experiment are calculated as
follows:
E save/week = E total Re f Scene − E total O pt Scene
(6.1)
E save/week = 193.195,6 kW h − 181.422,8 kW h = 11.772,8 kW h
E save/week = 11.772,8 kW h = 11,8 MW h
E save/month = 11,8 MW h ∗
52
12 = 51,0 MW h
c save/month = 51,0 MW h ∗ 142,02 e = 7.243,02 e
with E save/week
calculated weekly energy savings
E save/month calculated monthly energy savings
c save/month
calculated monthly cost savings
By optimizing the operation mode of the production lines under consideration, the energy costs for these two lines can be reduced by 7.200 e/month
(87.000 e/year). The next step is to extend the scope of the simulation-based
optimization to the consideration of entire production areas in the model. The
extension of the model allows a statement about the scalability of the results.
If the optimization potential for all production lines and machines is as high as
in the area under consideration, it can be assumed that consumption-dependent
energy costs at Bosch can be reduced by 6%.
189
Table 6.10 Price components of the electricity supply contract
Unit
Price
Electricity costs work (day tariff)
MWh
41,15 e
EEG apportionment
MWh
67,92 e
Sum of electricity taxes and other charges
MWh
32,95 e
Total Costs
142,02 e
The total energy consumption savings that result from using the optimization parameters proposed in the total consumption experiment are calculated as
follows:
E save/week = E total Re f Scene − E total O pt Scene
(6.1)
E save/week = 193.195,6 kW h − 181.422,8 kW h = 11.772,8 kW h
E save/week = 11.772,8 kW h = 11,8 MW h
E save/month = 11,8 MW h ∗
52
12 = 51,0 MW h
c save/month = 51,0 MW h ∗ 142,02 e = 7.243,02 e
with E save/week
calculated weekly energy savings
E save/month calculated monthly energy savings
c save/month
calculated monthly cost savings
By optimizing the operation mode of the production lines under consideration, the energy costs for these two lines can be reduced by 7.200 e/month
(87.000 e/year). The next step is to extend the scope of the simulation-based
optimization to the consideration of entire production areas in the model. The
extension of the model allows a statement about the scalability of the results.
If the optimization potential for all production lines and machines is as high as
in the area under consideration, it can be assumed that consumption-dependent
energy costs at Bosch can be reduced by 6%.