

184
6 Experimental Validation of the Methodology
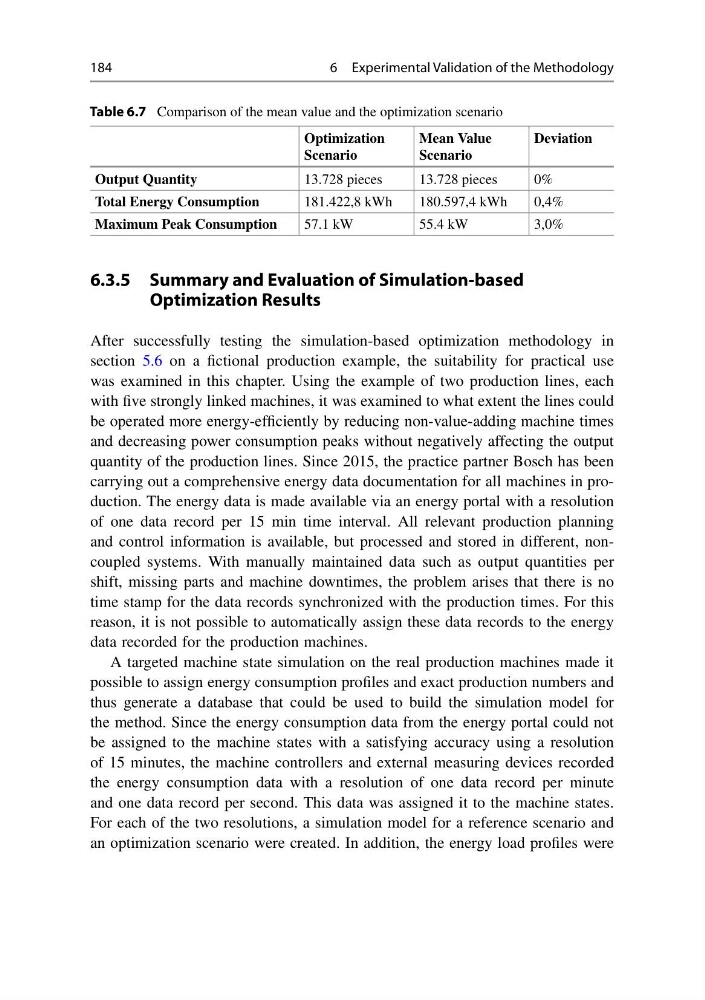
Table 6.7 Comparison of the mean value and the optimization scenario
Optimization
Scenario
Mean Value
Scenario
Deviation
Output Quantity
13.728 pieces
13.728 pieces
0%
Total Energy Consumption
181.422,8 kWh
180.597,4 kWh
0,4%
Maximum Peak Consumption
57.1 kW
55.4 kW
3,0%
6.3.5 Summary and Evaluation of Simulation-based
Optimization Results
After successfully testing the simulation-based optimization methodology in
section 5.6 on a fictional production example, the suitability for practical use
was examined in this chapter. Using the example of two production lines, each
with five strongly linked machines, it was examined to what extent the lines could
be operated more energy-efficiently by reducing non-value-adding machine times
and decreasing power consumption peaks without negatively affecting the output
quantity of the production lines. Since 2015, the practice partner Bosch has been
carrying out a comprehensive energy data documentation for all machines in production. The energy data is made available via an energy portal with a resolution
of one data record per 15 min time interval. All relevant production planning
and control information is available, but processed and stored in different, noncoupled systems. With manually maintained data such as output quantities per
shift, missing parts and machine downtimes, the problem arises that there is no
time stamp for the data records synchronized with the production times. For this
reason, it is not possible to automatically assign these data records to the energy
data recorded for the production machines.
A targeted machine state simulation on the real production machines made it
possible to assign energy consumption profiles and exact production numbers and
thus generate a database that could be used to build the simulation model for
the method. Since the energy consumption data from the energy portal could not
be assigned to the machine states with a satisfying accuracy using a resolution
of 15 minutes, the machine controllers and external measuring devices recorded
the energy consumption data with a resolution of one data record per minute
and one data record per second. This data was assigned it to the machine states.
For each of the two resolutions, a simulation model for a reference scenario and
an optimization scenario were created. In addition, the energy load profiles were
6 Experimental Validation of the Methodology
Table 6.7 Comparison of the mean value and the optimization scenario
Optimization
Scenario
Mean Value
Scenario
Deviation
Output Quantity
13.728 pieces
13.728 pieces
0%
Total Energy Consumption
181.422,8 kWh
180.597,4 kWh
0,4%
Maximum Peak Consumption
57.1 kW
55.4 kW
3,0%
6.3.5 Summary and Evaluation of Simulation-based
Optimization Results
After successfully testing the simulation-based optimization methodology in
section 5.6 on a fictional production example, the suitability for practical use
was examined in this chapter. Using the example of two production lines, each
with five strongly linked machines, it was examined to what extent the lines could
be operated more energy-efficiently by reducing non-value-adding machine times
and decreasing power consumption peaks without negatively affecting the output
quantity of the production lines. Since 2015, the practice partner Bosch has been
carrying out a comprehensive energy data documentation for all machines in production. The energy data is made available via an energy portal with a resolution
of one data record per 15 min time interval. All relevant production planning
and control information is available, but processed and stored in different, noncoupled systems. With manually maintained data such as output quantities per
shift, missing parts and machine downtimes, the problem arises that there is no
time stamp for the data records synchronized with the production times. For this
reason, it is not possible to automatically assign these data records to the energy
data recorded for the production machines.
A targeted machine state simulation on the real production machines made it
possible to assign energy consumption profiles and exact production numbers and
thus generate a database that could be used to build the simulation model for
the method. Since the energy consumption data from the energy portal could not
be assigned to the machine states with a satisfying accuracy using a resolution
of 15 minutes, the machine controllers and external measuring devices recorded
the energy consumption data with a resolution of one data record per minute
and one data record per second. This data was assigned it to the machine states.
For each of the two resolutions, a simulation model for a reference scenario and
an optimization scenario were created. In addition, the energy load profiles were