

178
6 Experimental Validation of the Methodology
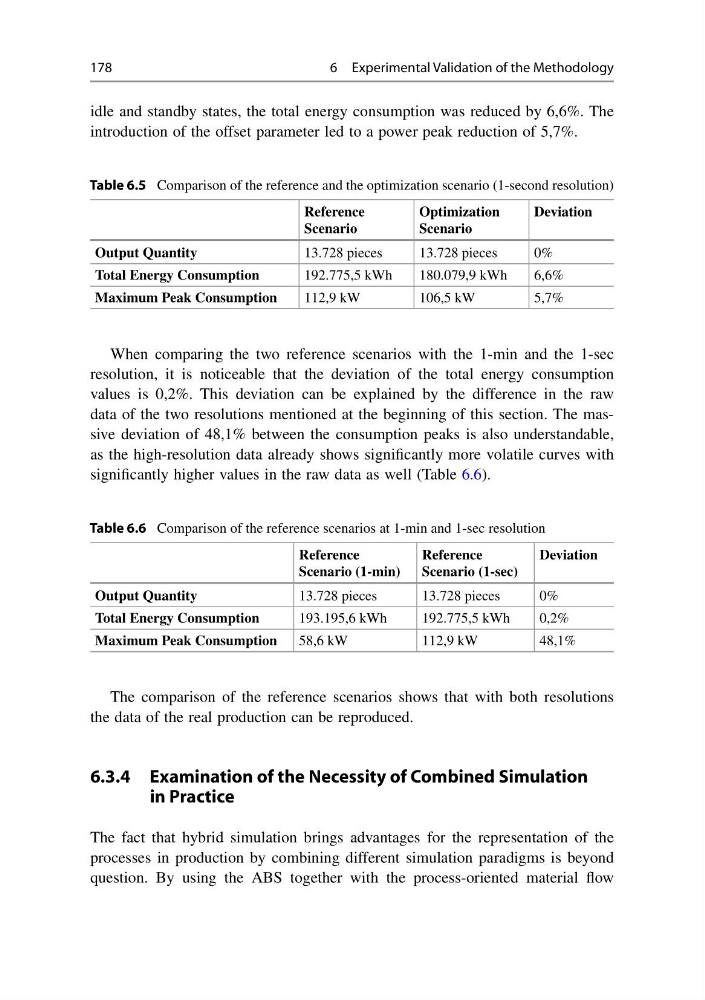
idle and standby states, the total energy consumption was reduced by 6,6%. The
introduction of the offset parameter led to a power peak reduction of 5,7%.
Table 6.5 Comparison of the reference and the optimization scenario (1-second resolution)
Reference
Scenario
Optimization
Scenario
Deviation
Output Quantity
13.728 pieces
13.728 pieces
0%
Total Energy Consumption
192.775,5 kWh
180.079,9 kWh
6,6%
Maximum Peak Consumption
112,9 kW
106,5 kW
5,7%
When comparing the two reference scenarios with the 1-min and the 1-sec
resolution, it is noticeable that the deviation of the total energy consumption
values is 0,2%. This deviation can be explained by the difference in the raw
data of the two resolutions mentioned at the beginning of this section. The massive deviation of 48,1% between the consumption peaks is also understandable,
as the high-resolution data already shows significantly more volatile curves with
significantly higher values in the raw data as well (Table 6.6).
Table 6.6 Comparison of the reference scenarios at 1-min and 1-sec resolution
Reference
Scenario (1-min)
Reference
Scenario (1-sec)
Deviation
Output Quantity
13.728 pieces
13.728 pieces
0%
Total Energy Consumption
193.195,6 kWh
192.775,5 kWh
0,2%
Maximum Peak Consumption
58,6 kW
112,9 kW
48,1%
The comparison of the reference scenarios shows that with both resolutions
the data of the real production can be reproduced.
6.3.4 Examination of the Necessity of Combined Simulation
in Practice
The fact that hybrid simulation brings advantages for the representation of the
processes in production by combining different simulation paradigms is beyond
question. By using the ABS together with the process-oriented material flow
6 Experimental Validation of the Methodology
idle and standby states, the total energy consumption was reduced by 6,6%. The
introduction of the offset parameter led to a power peak reduction of 5,7%.
Table 6.5 Comparison of the reference and the optimization scenario (1-second resolution)
Reference
Scenario
Optimization
Scenario
Deviation
Output Quantity
13.728 pieces
13.728 pieces
0%
Total Energy Consumption
192.775,5 kWh
180.079,9 kWh
6,6%
Maximum Peak Consumption
112,9 kW
106,5 kW
5,7%
When comparing the two reference scenarios with the 1-min and the 1-sec
resolution, it is noticeable that the deviation of the total energy consumption
values is 0,2%. This deviation can be explained by the difference in the raw
data of the two resolutions mentioned at the beginning of this section. The massive deviation of 48,1% between the consumption peaks is also understandable,
as the high-resolution data already shows significantly more volatile curves with
significantly higher values in the raw data as well (Table 6.6).
Table 6.6 Comparison of the reference scenarios at 1-min and 1-sec resolution
Reference
Scenario (1-min)
Reference
Scenario (1-sec)
Deviation
Output Quantity
13.728 pieces
13.728 pieces
0%
Total Energy Consumption
193.195,6 kWh
192.775,5 kWh
0,2%
Maximum Peak Consumption
58,6 kW
112,9 kW
48,1%
The comparison of the reference scenarios shows that with both resolutions
the data of the real production can be reproduced.
6.3.4 Examination of the Necessity of Combined Simulation
in Practice
The fact that hybrid simulation brings advantages for the representation of the
processes in production by combining different simulation paradigms is beyond
question. By using the ABS together with the process-oriented material flow