

166
6 Experimental Validation of the Methodology
For the model validation, the model logic has been crosschecked several times
before it was used to reproduce a number of production days of historical data 6 .
After repeated fine-tuning of the modeled material flow parameters as well as
multiple revisions of the entered machine state transition rules, the hybrid simulation reproduced the production data with a deviation of less than 3.2 percent. The
occurring deviation of 3.2 percent per shift can be explained considering machine
failures in the real production. As the machine failures can hardly be predicted
correctly, they have not been considered in the hybrid model. As failures occurred in practice, but not in the model, the part numbers produced in the simulation
runs have been slightly higher than in practice. For future simulation runs, it is
possible to consider a failure probability for all machines in the machine logic if
the focus is on getting the output numbers of the model closer to the ones in the
real production. Including failure probabilities adds a stochastic to the simulation
model and thus requires the setup of replications in the optimization experiments.
To be able to simulate and compare different energy data resolutions as well as
the use of mean values 7 , the simulation model is duplicated, using different energy
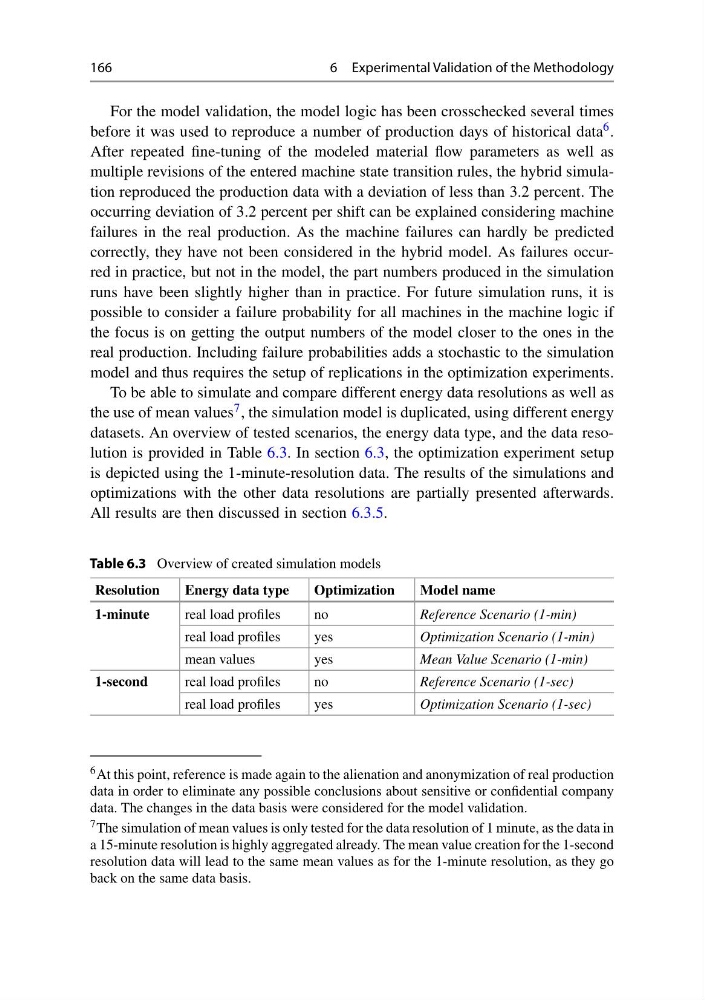
datasets. An overview of tested scenarios, the energy data type, and the data resolution is provided in Table 6.3. In section 6.3, the optimization experiment setup
is depicted using the 1-minute-resolution data. The results of the simulations and
optimizations with the other data resolutions are partially presented afterwards.
All results are then discussed in section 6.3.5.
Table 6.3 Overview of created simulation models
Resolution
Energy data type
Optimization
Model name
1-minute
real load profiles
no
Reference Scenario (1-min)
real load profiles
yes
Optimization Scenario (1-min)
mean values
yes
Mean Value Scenario (1-min)
1-second
real load profiles
no
Reference Scenario (1-sec)
real load profiles
yes
Optimization Scenario (1-sec)
6 At this point, reference is made again to the alienation and anonymization of real production
data in order to eliminate any possible conclusions about sensitive or confidential company
data. The changes in the data basis were considered for the model validation.
7 The simulation of mean values is only tested for the data resolution of 1 minute, as the data in
a 15-minute resolution is highly aggregated already. The mean value creation for the 1-second
resolution data will lead to the same mean values as for the 1-minute resolution, as they go
back on the same data basis.
6 Experimental Validation of the Methodology
For the model validation, the model logic has been crosschecked several times
before it was used to reproduce a number of production days of historical data 6 .
After repeated fine-tuning of the modeled material flow parameters as well as
multiple revisions of the entered machine state transition rules, the hybrid simulation reproduced the production data with a deviation of less than 3.2 percent. The
occurring deviation of 3.2 percent per shift can be explained considering machine
failures in the real production. As the machine failures can hardly be predicted
correctly, they have not been considered in the hybrid model. As failures occurred in practice, but not in the model, the part numbers produced in the simulation
runs have been slightly higher than in practice. For future simulation runs, it is
possible to consider a failure probability for all machines in the machine logic if
the focus is on getting the output numbers of the model closer to the ones in the
real production. Including failure probabilities adds a stochastic to the simulation
model and thus requires the setup of replications in the optimization experiments.
To be able to simulate and compare different energy data resolutions as well as
the use of mean values 7 , the simulation model is duplicated, using different energy
datasets. An overview of tested scenarios, the energy data type, and the data resolution is provided in Table 6.3. In section 6.3, the optimization experiment setup
is depicted using the 1-minute-resolution data. The results of the simulations and
optimizations with the other data resolutions are partially presented afterwards.
All results are then discussed in section 6.3.5.
Table 6.3 Overview of created simulation models
Resolution
Energy data type
Optimization
Model name
1-minute
real load profiles
no
Reference Scenario (1-min)
real load profiles
yes
Optimization Scenario (1-min)
mean values
yes
Mean Value Scenario (1-min)
1-second
real load profiles
no
Reference Scenario (1-sec)
real load profiles
yes
Optimization Scenario (1-sec)
6 At this point, reference is made again to the alienation and anonymization of real production
data in order to eliminate any possible conclusions about sensitive or confidential company
data. The changes in the data basis were considered for the model validation.
7 The simulation of mean values is only tested for the data resolution of 1 minute, as the data in
a 15-minute resolution is highly aggregated already. The mean value creation for the 1-second
resolution data will lead to the same mean values as for the 1-minute resolution, as they go
back on the same data basis.